Society Admin Dashboard
Role Required: SOCIETY_ADMIN
Navigation: Sidebar → Dashboard
Last Updated: March 2026 | Portal Version: 1.0
Overview
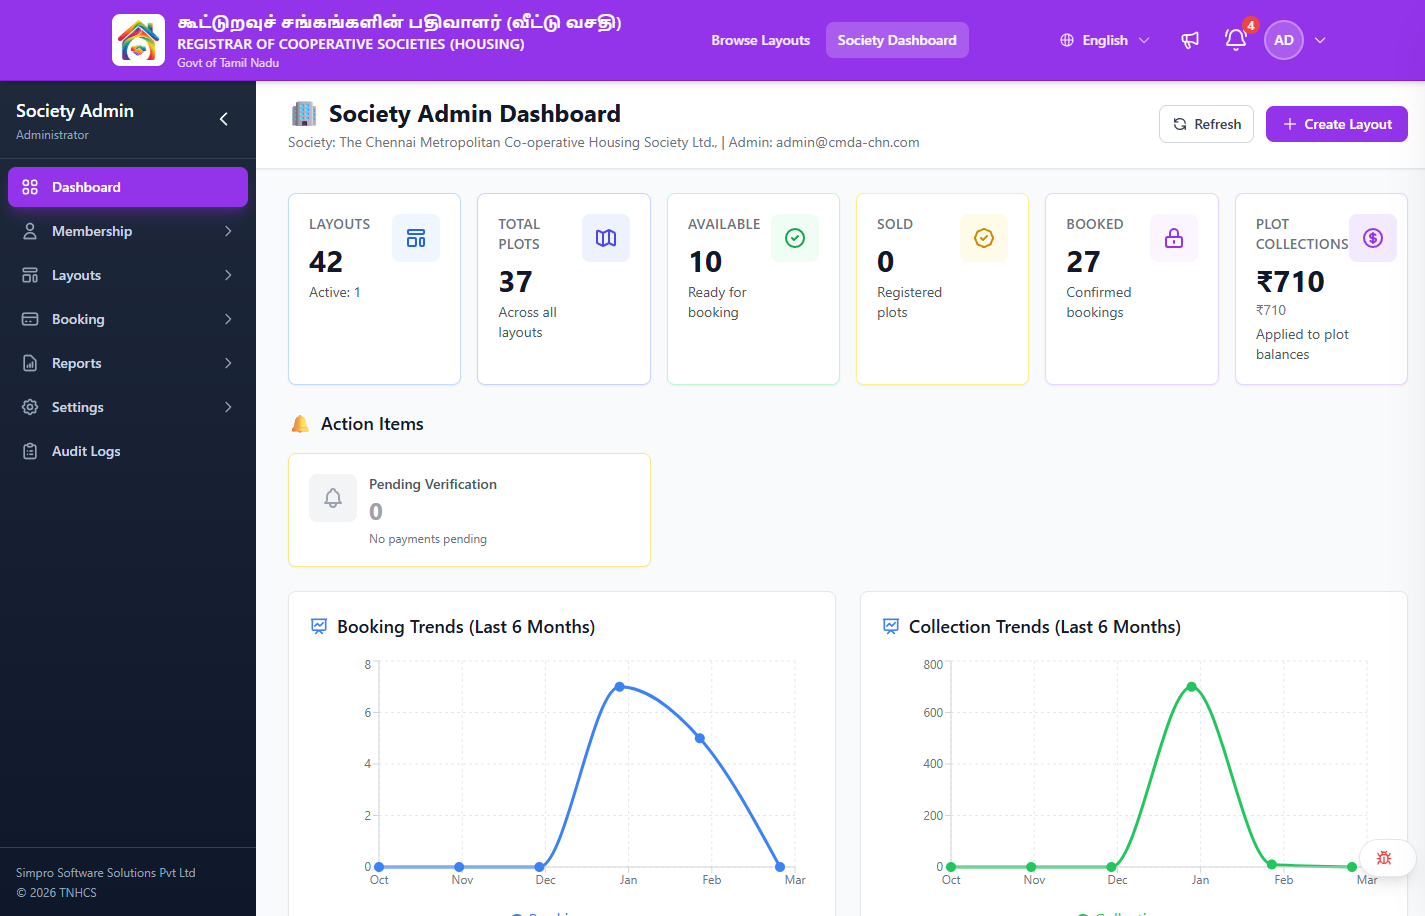
The Society Admin Dashboard is your command center. It provides a real-time snapshot of your society's operational health — layout and plot inventory, booking and collection trends, website visitors, action items, and recent layouts — all on a single screen.
Header Actions
At the top of the dashboard, you'll find:
| Action | Description |
|---|---|
| Refresh | Reloads all dashboard data |
| + Create Layout | Navigates to the layout creation page |
The header also shows your society name and admin email for reference.
Summary Cards
The top row displays six key metric cards providing an at-a-glance inventory overview:
| Card | What It Shows | Detail |
|---|---|---|
| Layouts | Total number of layouts in your society | Shows count of Active layouts |
| Total Plots | Total plots across all layouts | "Across all layouts" |
| Available | Plots open for booking | "Ready for booking" |
| Sold | Fully registered plots | "Registered plots" |
| Booked | Plots with confirmed bookings | "Confirmed bookings" |
| Plot Collections | Total ₹ collected | Amount applied to plot balances |
Click on the Layouts or Total Plots cards to navigate to the respective management pages.
Action Items
Below the summary cards, the Action Items section highlights tasks that need your attention:
| Item | Description |
|---|---|
| Pending Verification | Number of offline payments awaiting verification through the maker-checker process |
Click the pending verification card to go directly to the Receipt Verification page.
Trend Charts
Booking Trends (Last 6 Months)
A line chart showing the number of new bookings created per month over the last six months.
How to read it:
- Rising line = increasing demand for plots
- Flat line = steady state
- Declining line = may need marketing attention or inventory refresh
Collection Trends (Last 6 Months)
A line chart showing collection amounts per month over the last six months.
How to read it:
- Rising line = growing collection momentum
- Spikes = months with higher payment activity (e.g., milestone due dates)
- Dips = months with lower collections — may need follow-up
Website Visitors
This section tracks visitor traffic to your society's public layout pages:
| Metric | Description |
|---|---|
| Today | Number of visitors today |
| 30 Days | Visitors in the last 30 days |
| Total | All-time total visitors |
Recent Layouts
A table showing the most recent layouts in your society:
| Column | Description |
|---|---|
| Layout | Layout name and code (e.g., CMDA-CHN-MOCC) |
| Status | Current status — DRAFT, ACTIVE, INACTIVE, or ARCHIVED |
| Plots | Total number of plots in the layout |
| Available | Number of available (bookable) plots |
| Actions | Quick links: View (layout details) and Plots (plot management) |
Click View All → to navigate to the full Manage Layouts page.
Common Scenarios
"The pending verification count seems wrong"
The Pending Verification count shows offline payments in RECORDED status awaiting verification. If the count seems off, check the Receipt Verification page directly. Cached data refreshes every few minutes — use the Refresh button to force a reload.
"Collection amounts don't match my calculations"
The dashboard chart shows verified payments only:
- Online payments confirmed by the payment gateway
- Offline payments that have been verified (not just recorded) through the maker-checker process
Payments in RECORDED status (awaiting verification) are not counted until verified.
"I can't see data for another society"
Society Admin access is scoped to your assigned society only. You cannot view data from other societies. Contact your Super Admin to assign you an additional Society Admin role if needed.
Related Pages
- Membership & KYC — Handle pending membership applications
- Reports — Detailed reporting beyond the dashboard
- Getting Started — Full sidebar navigation reference