State MIS Reports
Role Required: STATE_ADMIN
Navigation: Top Navbar → State MIS Reports
Route:/admin/state-mis-reports
Last Updated: March 2026 | Portal Version: 1.0
Overview
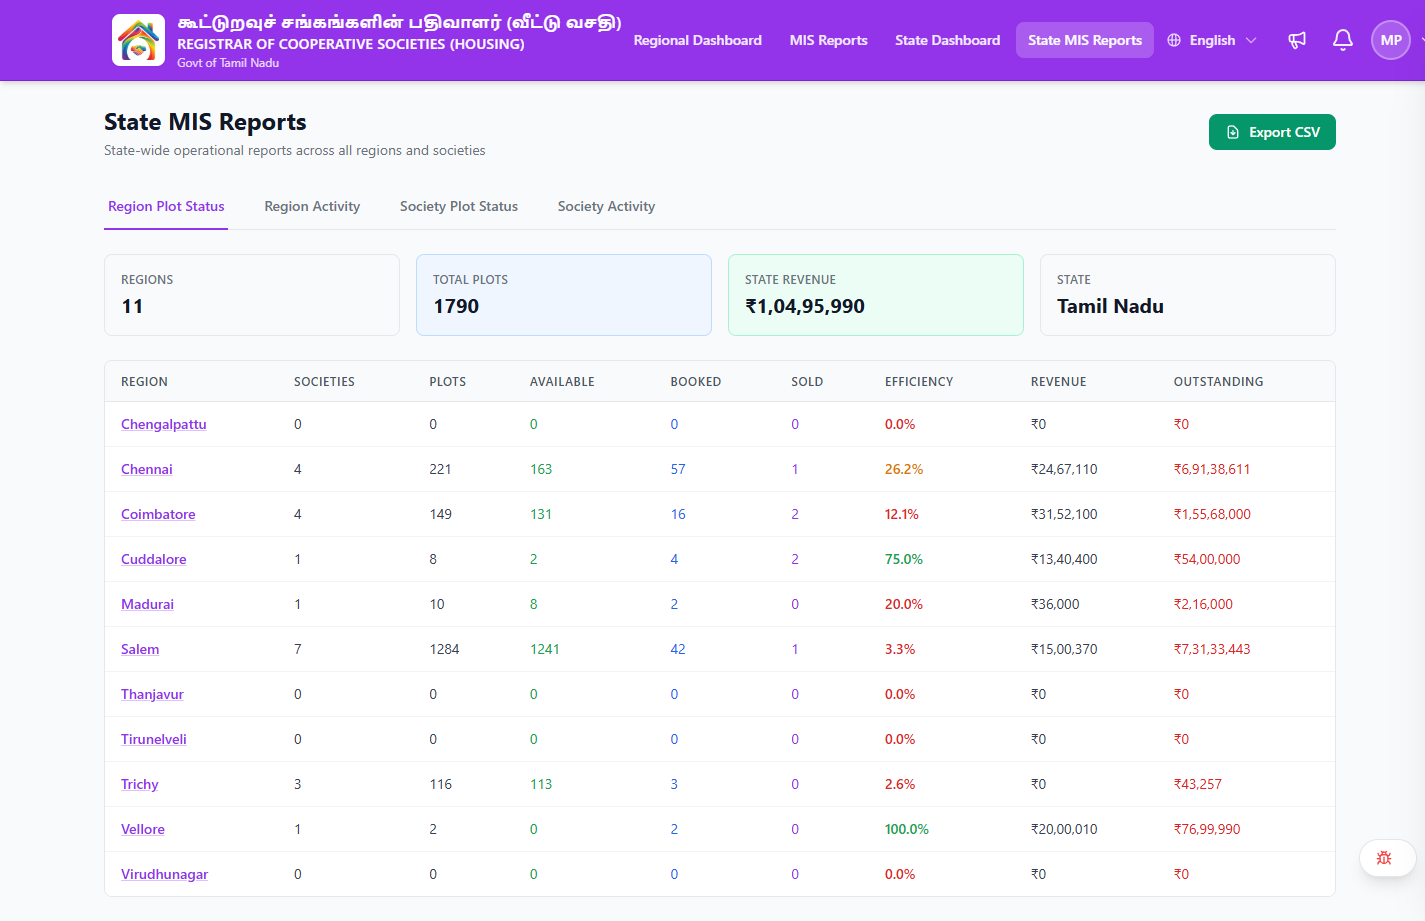
The State MIS Reports page provides state-wide operational reports aggregated across all regions. It shows region-level plot status, activity data, revenue, and outstanding amounts in a tabular format with export capability.
Page Header
- Title: State MIS Reports
- Subtitle: "State-wide operational reports across all regions and societies"
- Export CSV button — exports the current tab's table data
Report Tabs
The page has four tabs that provide different views of the region-level data:
| Tab | Description |
|---|---|
| Region Plot Status | Plot inventory, booking status, efficiency, revenue, and outstanding per region |
| Region Activity | Region activity data with the same structure |
| Society Plot Status | Region-level aggregated society plot data |
| Society Activity | Region-level aggregated society activity data |
Each tab shows the same summary cards and table structure with region-level data. Region names are clickable buttons.
Summary Cards
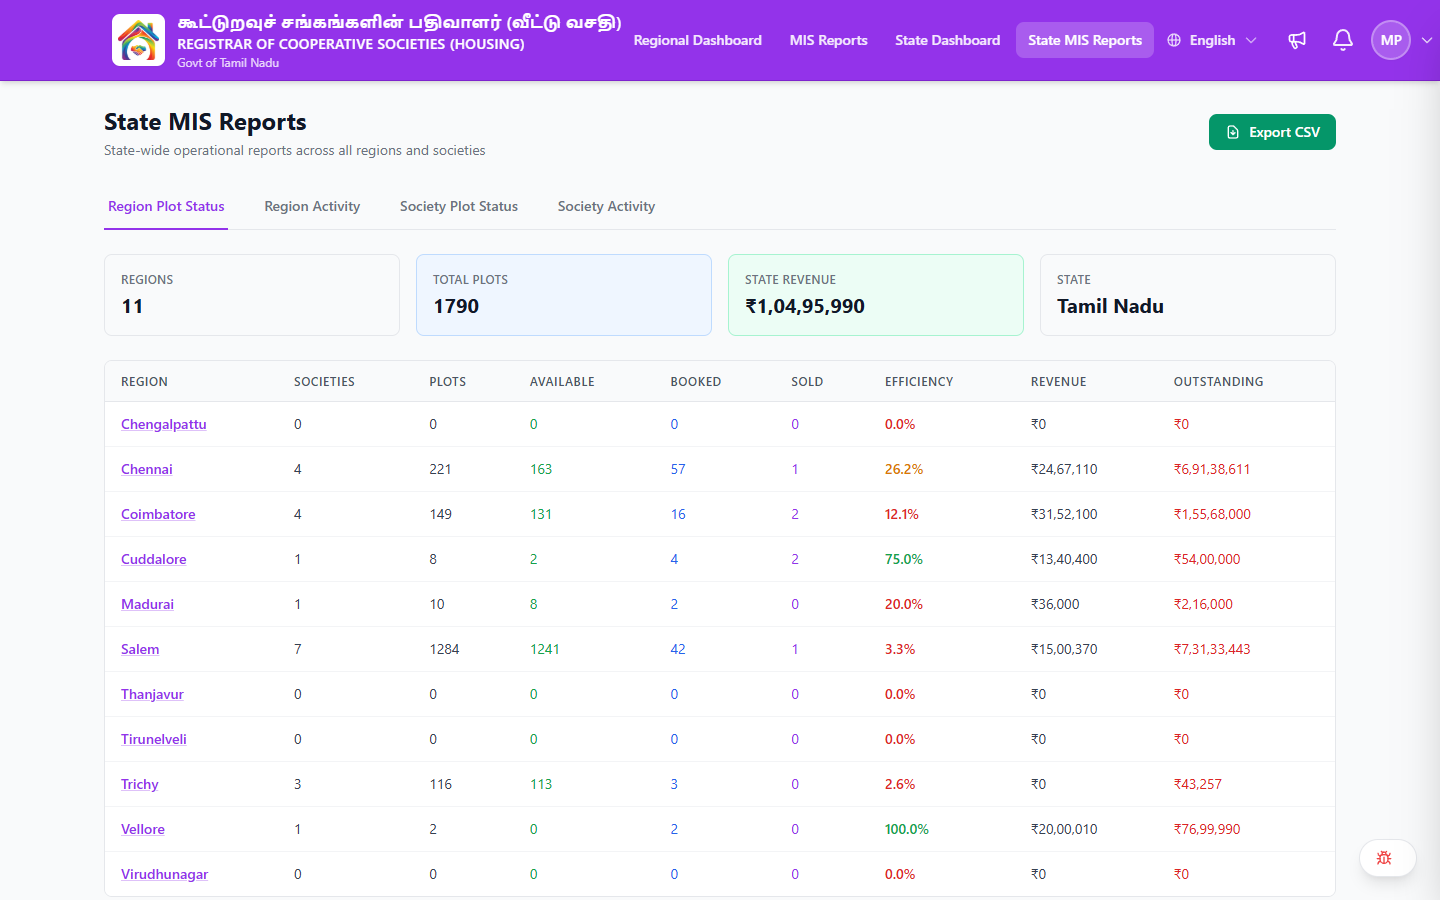
At the top of every tab, four summary cards display state-level totals:
| Card | Description | Example |
|---|---|---|
| Regions | Total number of regions | 11 |
| Total Plots | Total plots across all regions | 1,790 |
| State Revenue | Total revenue state-wide | ₹1,04,95,990 |
| State | State name | Tamil Nadu |
Data Table
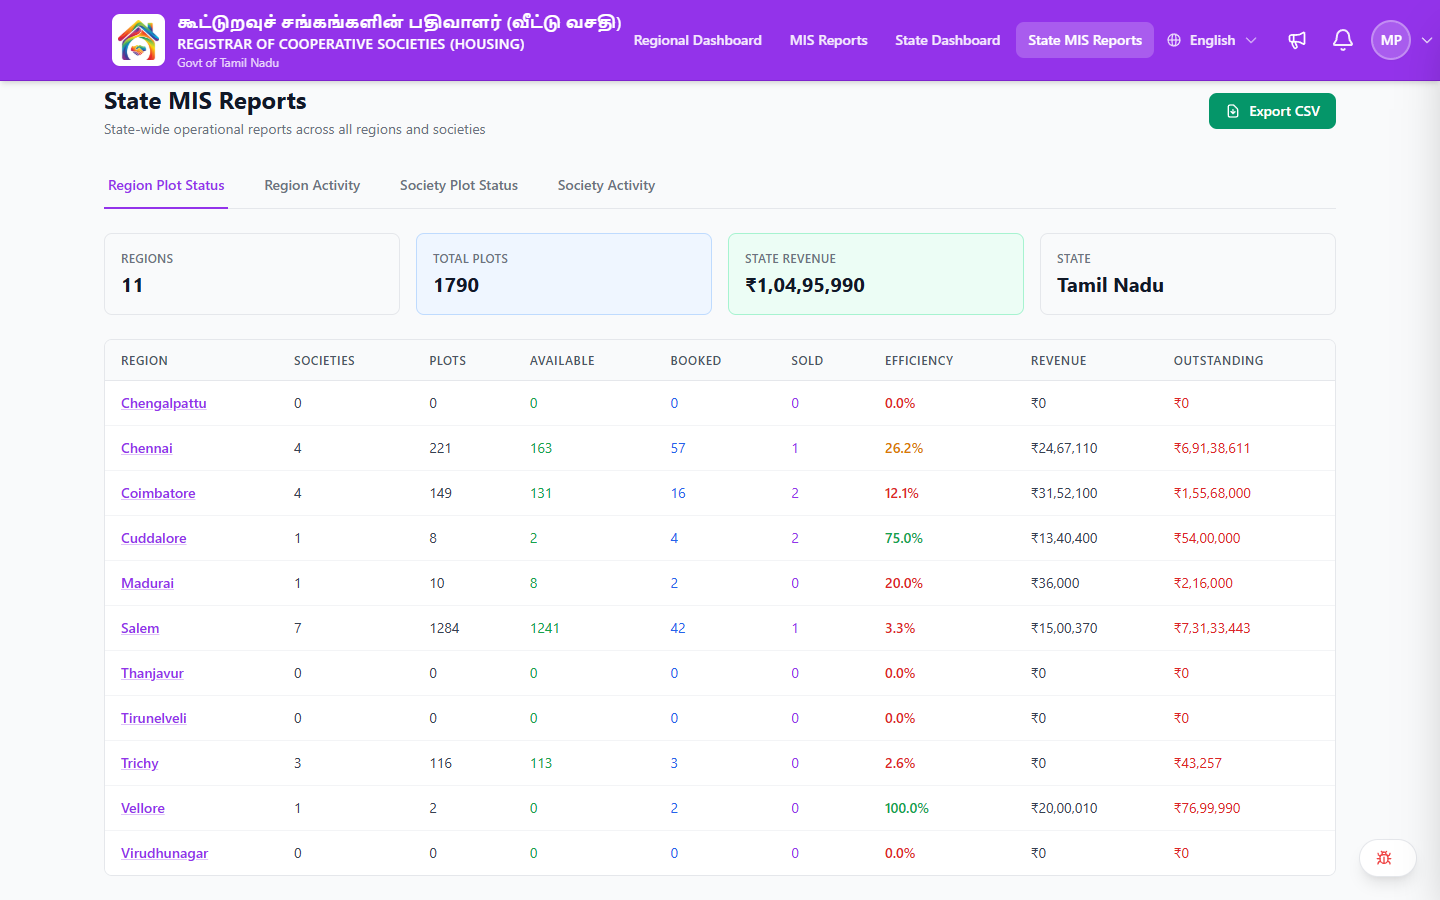
The main table shows one row per region:
| Column | Description |
|---|---|
| Region | Region name — clickable button |
| Societies | Number of societies in the region |
| Plots | Total plots |
| Available | Available plots |
| Booked | Booked plots |
| Sold | Sold plots |
| Efficiency | Booking efficiency percentage |
| Revenue | Total revenue collected |
| Outstanding | Outstanding amount due |
Reading the Table
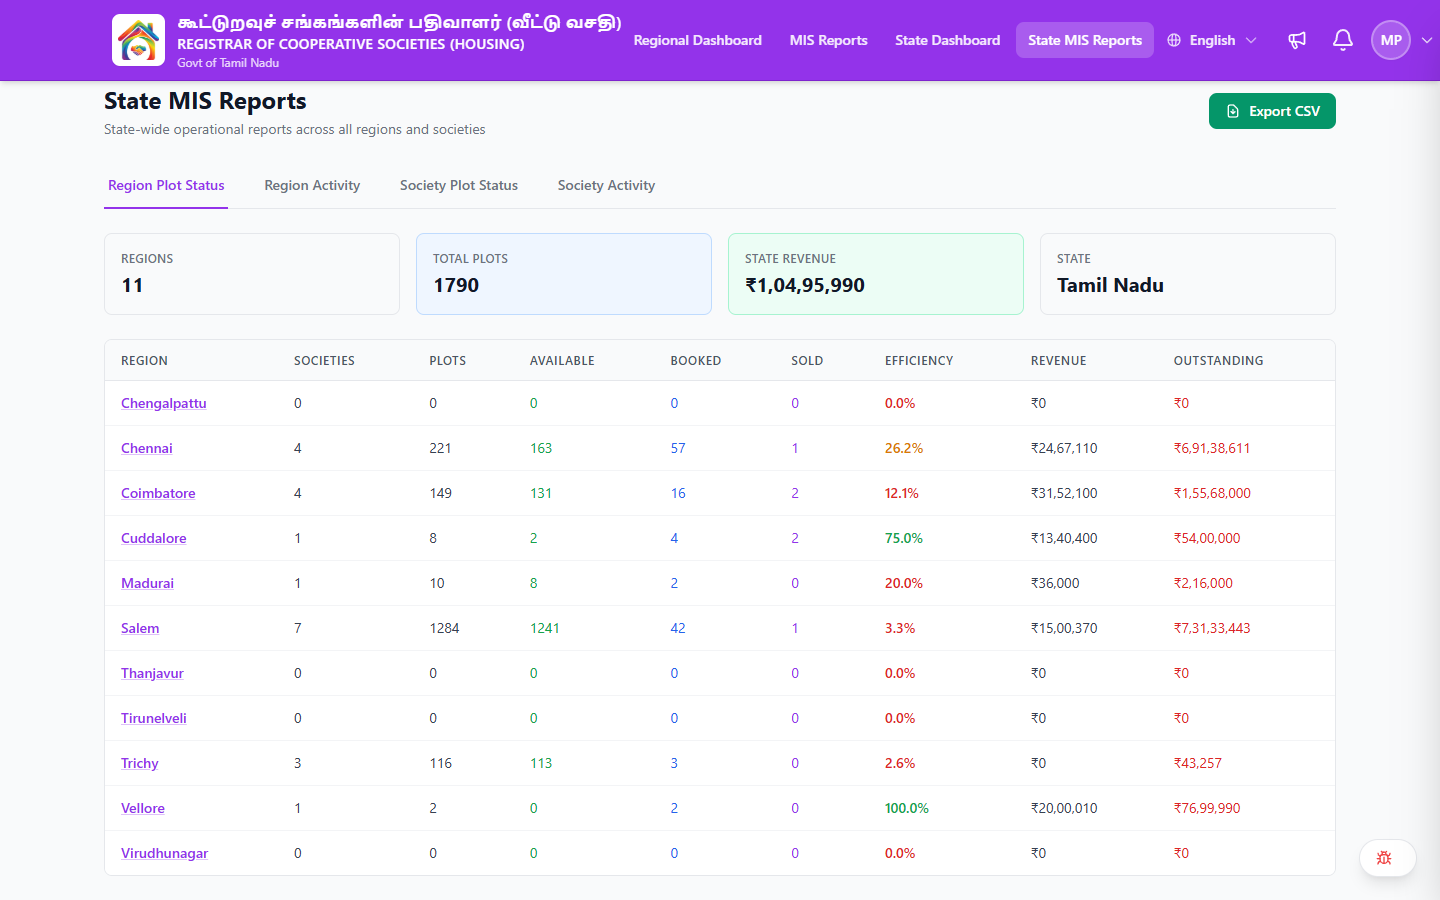
- Efficiency indicates how well plots are being converted (booked + sold as percentage of total)
- Revenue vs Outstanding gives a quick picture of collection health
- Regions with 0 societies/plots are newly created or inactive
Exporting Data
- Select the desired tab
- Click the Export CSV button (top right)
- The CSV file includes all columns from the table for the selected tab
Using State MIS Reports
Quick State Overview
- Open the page — summary cards show top-level numbers
- Scan the table — which regions have the highest/lowest efficiency?
- Check Outstanding column — any regions with high outstanding amounts?
Identifying Underperforming Regions
- Sort/scan by Efficiency — regions with low percentages need attention
- Compare Revenue vs Outstanding — high outstanding with low revenue indicates collection issues
- Check regions with 0 values — may need activation or society onboarding
Preparing Reports
- Select the appropriate tab for the data you need
- Review the data on screen
- Click Export CSV for the full dataset
- Use the exported CSV in spreadsheets for further analysis
Common Scenarios
"I need a quick snapshot of state-wide plot status"
- Navigate to State MIS Reports
- The Region Plot Status tab (default) shows all regions with plot counts
- Summary cards give you the top-line: total regions, plots, and revenue
- Export CSV if you need the data in a spreadsheet
"Which regions have the most outstanding revenue?"
- View the Region Plot Status tab
- Check the Outstanding column
- Regions with high outstanding values relative to their revenue need collection follow-up
- Drill into the region via the Regional Dashboard to identify which societies contribute
"I need region-by-region efficiency data for a presentation"
- View the Region Plot Status tab
- Note the Efficiency column for each region
- Click Export CSV for the full dataset
- Import into your presentation tool
Related Pages
- State Dashboard — State-wide KPAs and regional performance table
- Regional MIS Reports — Society-level MIS reports by region
- Regional Oversight — Regional Dashboard drill-down
- State Financial Reports — Financial data overview