Regional Oversight
Role Required: STATE_ADMIN
Navigation: Top Navbar → Regional Dashboard
Route:/admin/regional-dashboard
Last Updated: March 2026 | Portal Version: 1.0
Overview
As a State Admin, the Regional Dashboard gives you the same view that a Regional Admin sees — but with a region selector dropdown that lets you switch between any region in your state. You can drill down from state → region → society to understand performance at every level.
You can reach the Regional Dashboard in two ways:
- Top Navbar → Regional Dashboard — click and select a region from the dropdown
- State Dashboard → View button — click "View" on any region in the Regional Performance Comparison table to jump directly to that region

Region Selector & Filters
At the top of the Regional Dashboard, you'll see:
| Control | Description |
|---|---|
| Region Dropdown | Select any region (e.g., "Chennai (4)", "Coimbatore (4)", "Salem (7)") — number in parentheses shows society count |
| Time Period | Today, This Week, This Month (default), All Time |
| Refresh | Reload dashboard data |
When you change the region, all dashboard sections update to show that region's data.

Dashboard Header
- Title: 🏛️ Regional Admin Dashboard
- Subtitle: Shows the selected region and officer name (e.g., "Region: Chennai | Officer: M.A.John Peter")
KPA Summary Cards
Six cards showing the selected region's key metrics:
| Card | Main Value | Subtitle |
|---|---|---|
| Societies / Layouts | Count/Count (e.g., 4 / 48) | Breakdowns (Societies: 4 | Layouts: 1) |
| Plots | Total plots (e.g., 221) | Available count (e.g., "Available: 163") |
| Sold Plots | Sold count (e.g., 1) | Percentage of total (e.g., "0.5% of total") |
| Plot Collections | Amount (e.g., ₹5) | Trend vs last month (e.g., "↓ 99.55% vs LM") |
| Members | Total members (e.g., 7) | New this month, pending count |
| Bookings | Total bookings (e.g., 4) | Confirmed count, conversion rate |

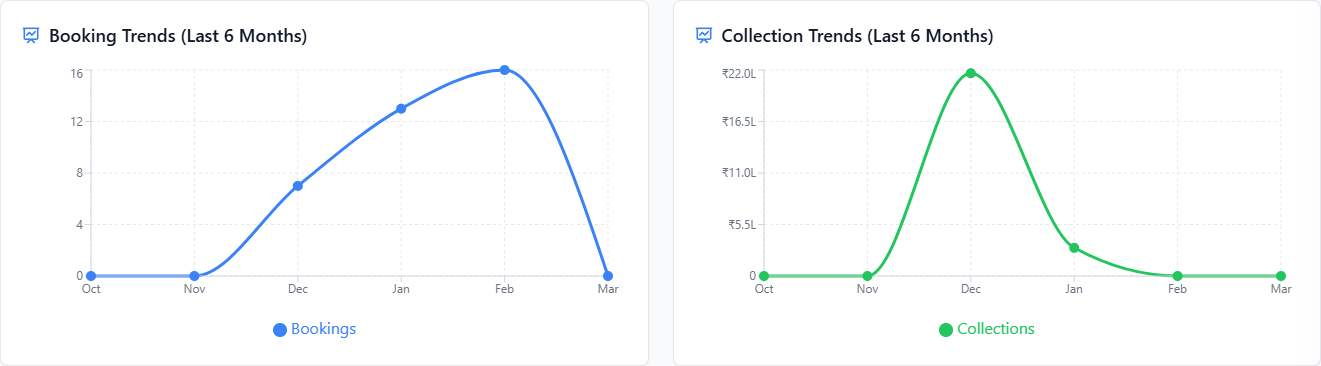
Regional Trends
Two charts showing the selected region's trends over the last 6 months:
Booking Trends (Last 6 Months)
- Monthly booking counts with bar chart
Collection Trends (Last 6 Months)
- Monthly collection amounts with bar chart
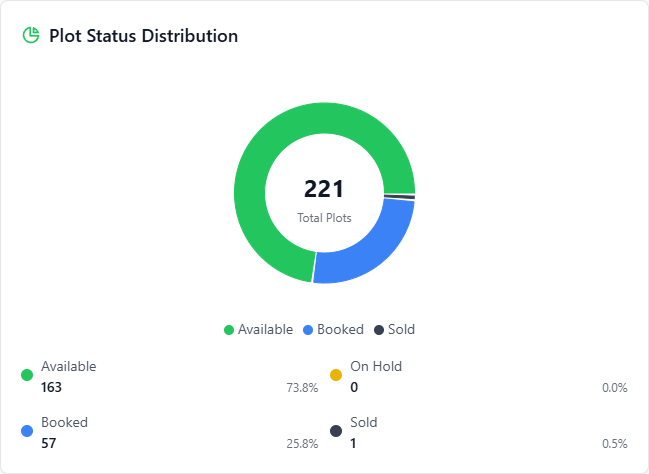
Plot Status Distribution
A donut chart showing the breakdown of plots in the selected region:
| Status | Description |
|---|---|
| Available | Plots ready for booking |
| On Hold | Temporarily held plots |
| Booked | Plots with active bookings |
| Sold | Fully sold plots |
Shows total plot count in the centre and percentage breakdowns below.
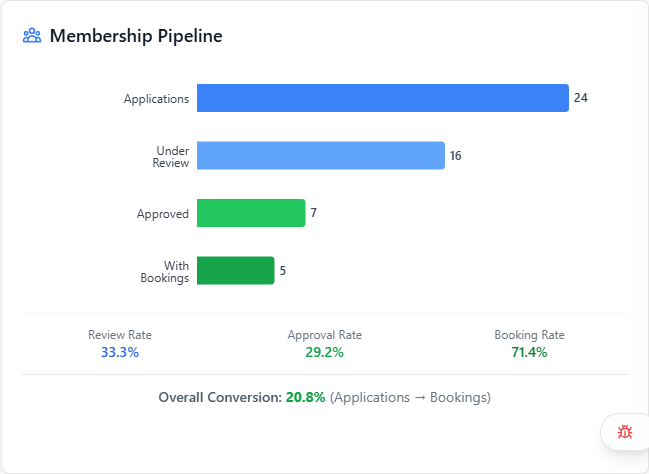
Membership Pipeline
A funnel chart showing the membership conversion flow:
| Stage | Description |
|---|---|
| Applications | Total membership applications received |
| Under Review | Applications currently being reviewed |
| Approved | Applications approved |
| With Bookings | Members who have made plot bookings |
Below the funnel, key conversion rates are shown:
- Review Rate — percentage of applications reviewed
- Approval Rate — percentage approved out of total
- Booking Rate — percentage of approved members with bookings
- Overall Conversion — Applications → Bookings percentage
Society-Wise Performance
A table showing each society's performance within the selected region:
| Column | Description |
|---|---|
| Society | Society name and short code |
| Layouts | Number of layouts |
| Plots | Total plots |
| Available | Available plots |
| Booked | Booked plots |
| Sold | Sold plots |
| Plot Revenue | Revenue from plot payments |
| Fee Revenue | Revenue from fees |
| Total | Combined revenue |
| Efficiency | 🟢 >80% / 🟡 50-80% / 🔴 <50% |
| Actions | View button — opens society detail page |
The table footer shows a TOTAL row and an Export button.
Legend: Efficiency = Plot Collections / Plot Revenue (excludes fees)
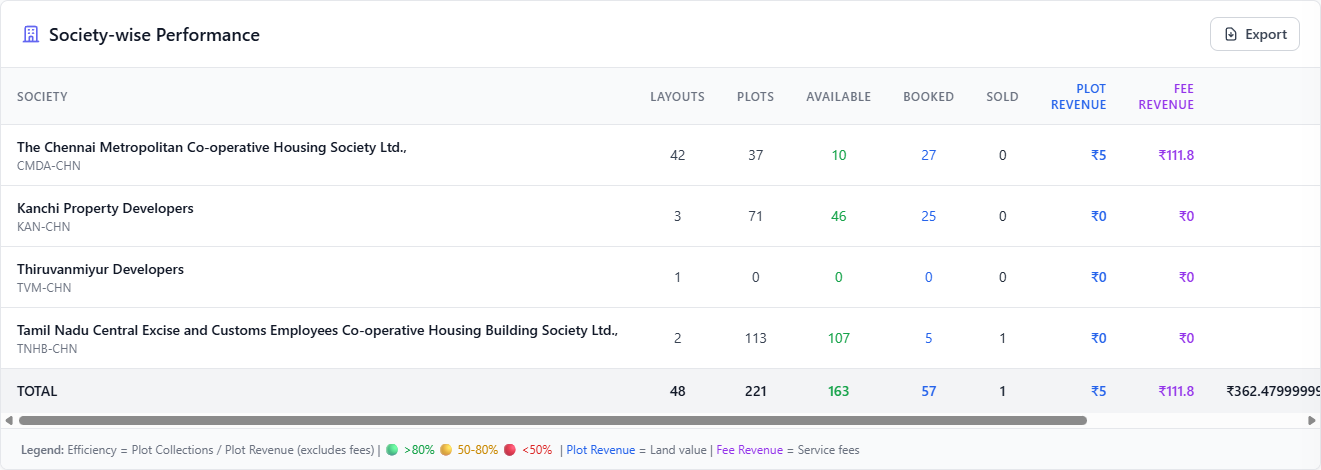
Click the View button on any society row to see that society's detailed dashboard — layouts, plot maps, booking details, and more.
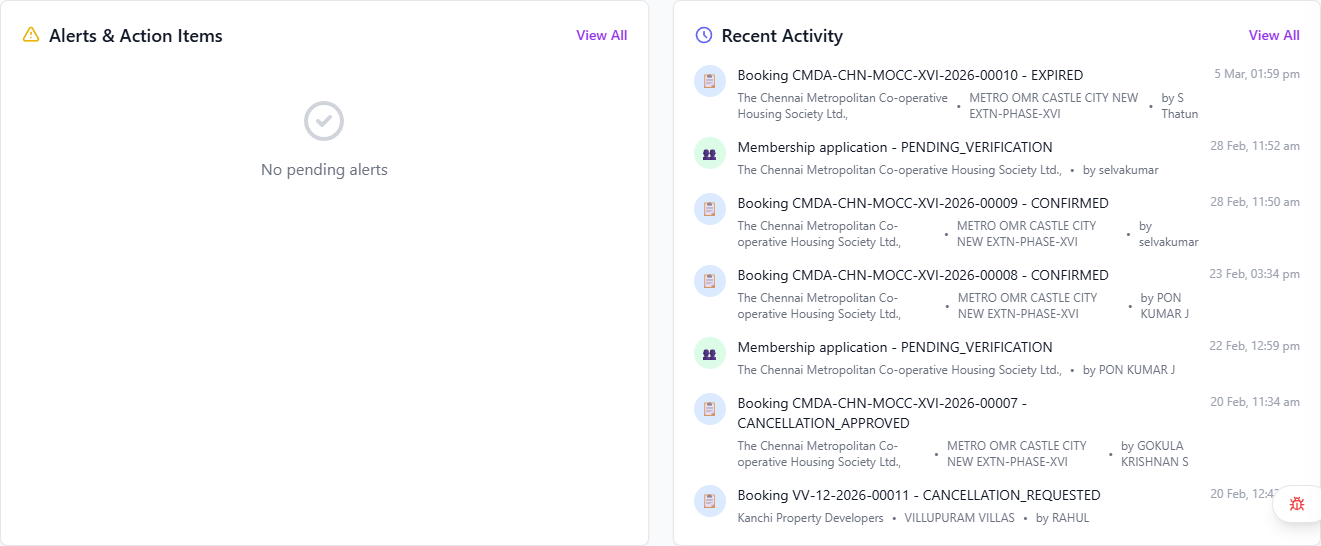
Alerts & Action Items
Alerts specific to the selected region, sorted by severity. The same alert format as the State Dashboard alerts.
Recent Activity
A timeline of recent actions in the selected region:
- Booking events — new bookings, confirmations, cancellations, expirations
- Membership events — new applications, verifications
- Each entry shows the society, layout (if applicable), member name, and timestamp
Click View All to see the full activity log.
Website Visitors
Same as the State Dashboard visitor section — Today, 30 Days, and Total counts.
Comparing Regions
To compare regions side by side:
| What to Compare | How |
|---|---|
| Revenue | Switch between regions in the dropdown, note revenue figures |
| Efficiency | Compare society-wise performance across regions |
| Growth | Check booking and collection trends per region |
| Scale | Compare society, layout, and plot counts |
For a faster comparison, use the State Dashboard's Regional Performance Comparison table which shows all regions at once.
Common Scenarios
"A region has low performance — what should I look at?"
- Select the region from the dropdown
- Check KPA Summary Cards — which metrics are low?
- Review Society-Wise Performance — is one society dragging down the region?
- Check Alerts — any unresolved issues?
- Review Trends — is performance declining or stagnant?
- Click View on the underperforming society for details
"I want to compare this quarter's regional performance with last quarter"
- View the Regional Dashboard for a region with "This Month" or "All Time" filter
- Note each society's performance
- Switch to another region and compare the same metrics
- For a state-wide comparison, use the State Dashboard Regional Performance table
"A region's alert was escalated to me"
- Navigate to the Regional Dashboard and select the affected region
- Check Alerts & Action Items for details
- Review Recent Activity for context
- Click View on the affected society for deeper investigation
- Contact the Regional Admin if needed
Related Pages
- State Dashboard — State-wide overview with all regions
- State MIS Reports — State-wide MIS data
- Regional MIS Reports — Society-level MIS reports by region
- Policy & Compliance — Regional compliance status