Regional MIS Reports
Role Required: STATE_ADMIN
Navigation: Top Navbar → MIS Reports
Route:/admin/regional-mis-reports
Last Updated: March 2026 | Portal Version: 1.0
Overview
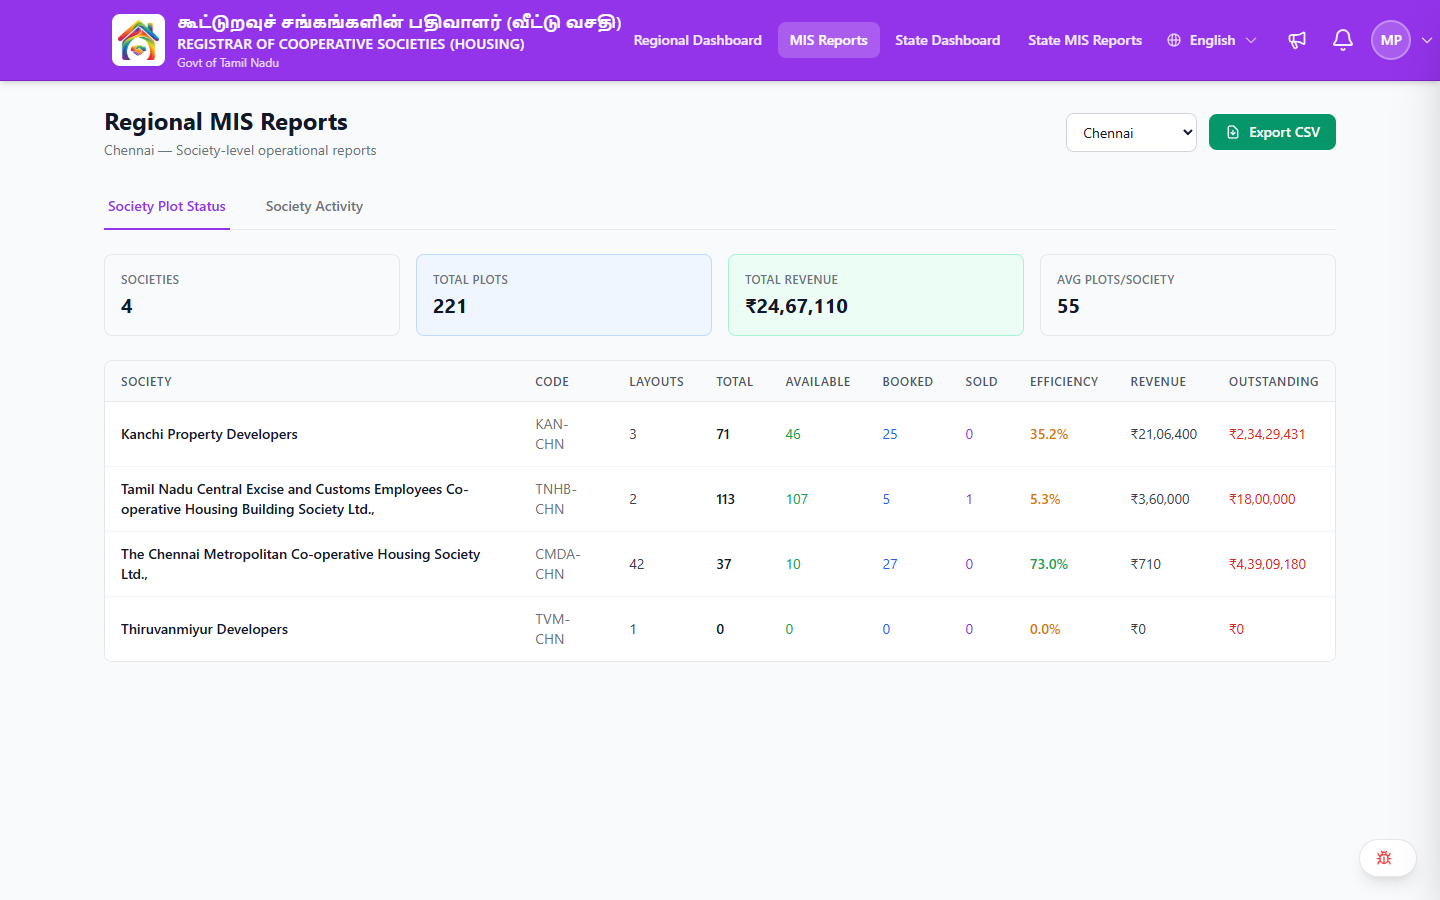
The Regional MIS Reports page shows society-level operational data for a selected region. As a State Admin, you get a region selector dropdown to switch between any region — unlike Regional Admins who only see their assigned region.
Page Header
- Title: Regional MIS Reports
- Subtitle: Dynamic — shows the selected region (e.g., "Chennai — Society-level operational reports")
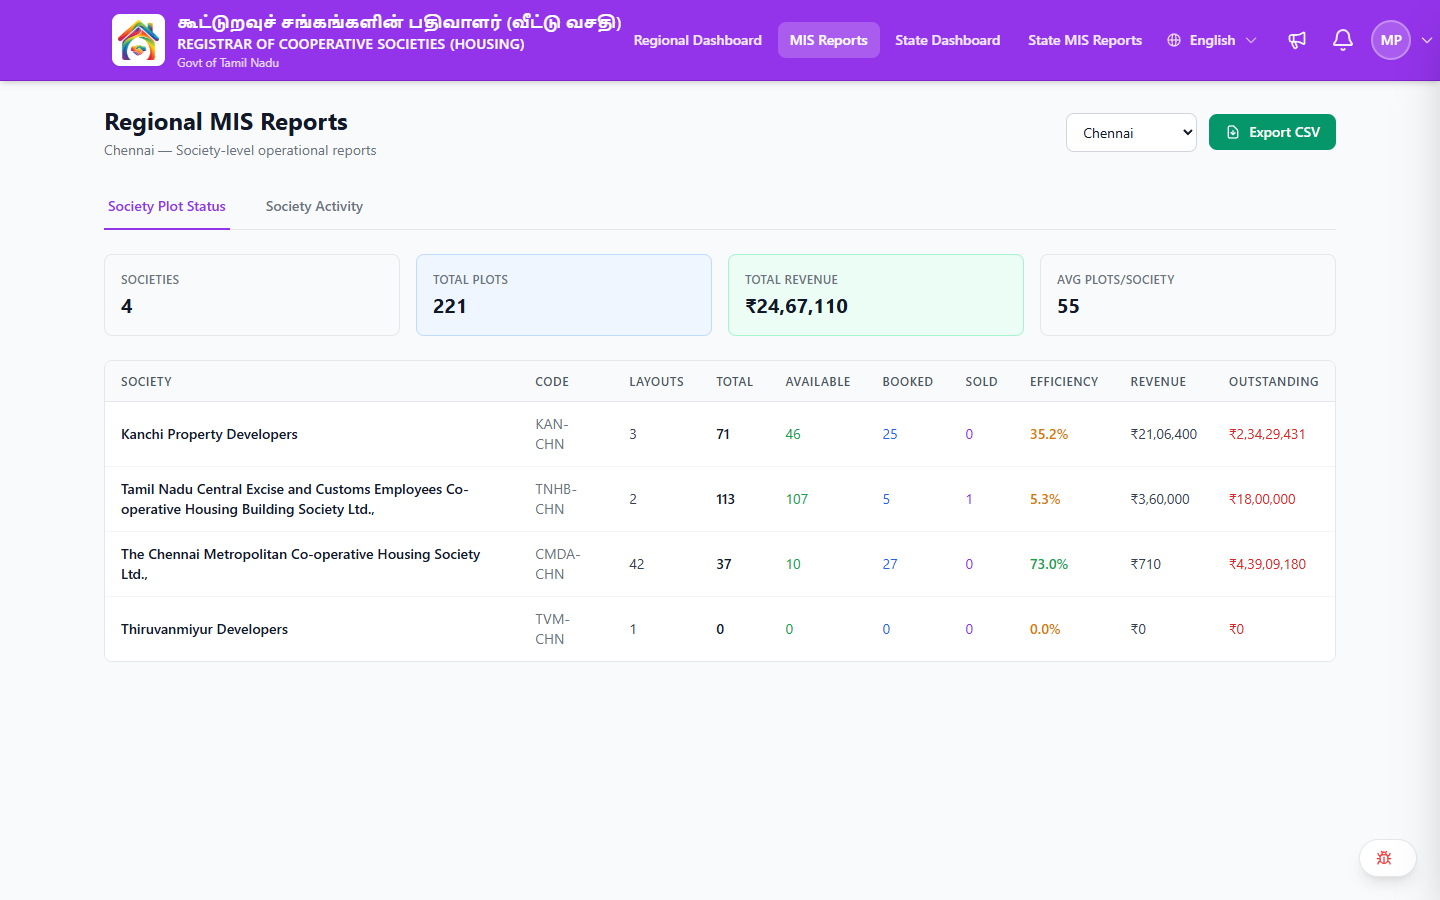
- Region Selector: Dropdown to switch between regions
- Export CSV button — exports the current tab's table data
Region Selector
| Control | Description |
|---|---|
| Region Dropdown | Lists all regions (e.g., Chennai, Coimbatore, Salem, Trichy, etc.) |
| Default | First region alphabetically or by assignment |
When you change the region, the subtitle, summary cards, and table all update to reflect the selected region's data.
Report Tabs
The page has two tabs:
| Tab | Description |
|---|---|
| Society Plot Status | Society-level plot inventory, efficiency, revenue, and outstanding data |
| Society Activity | Society-level activity data |
Summary Cards
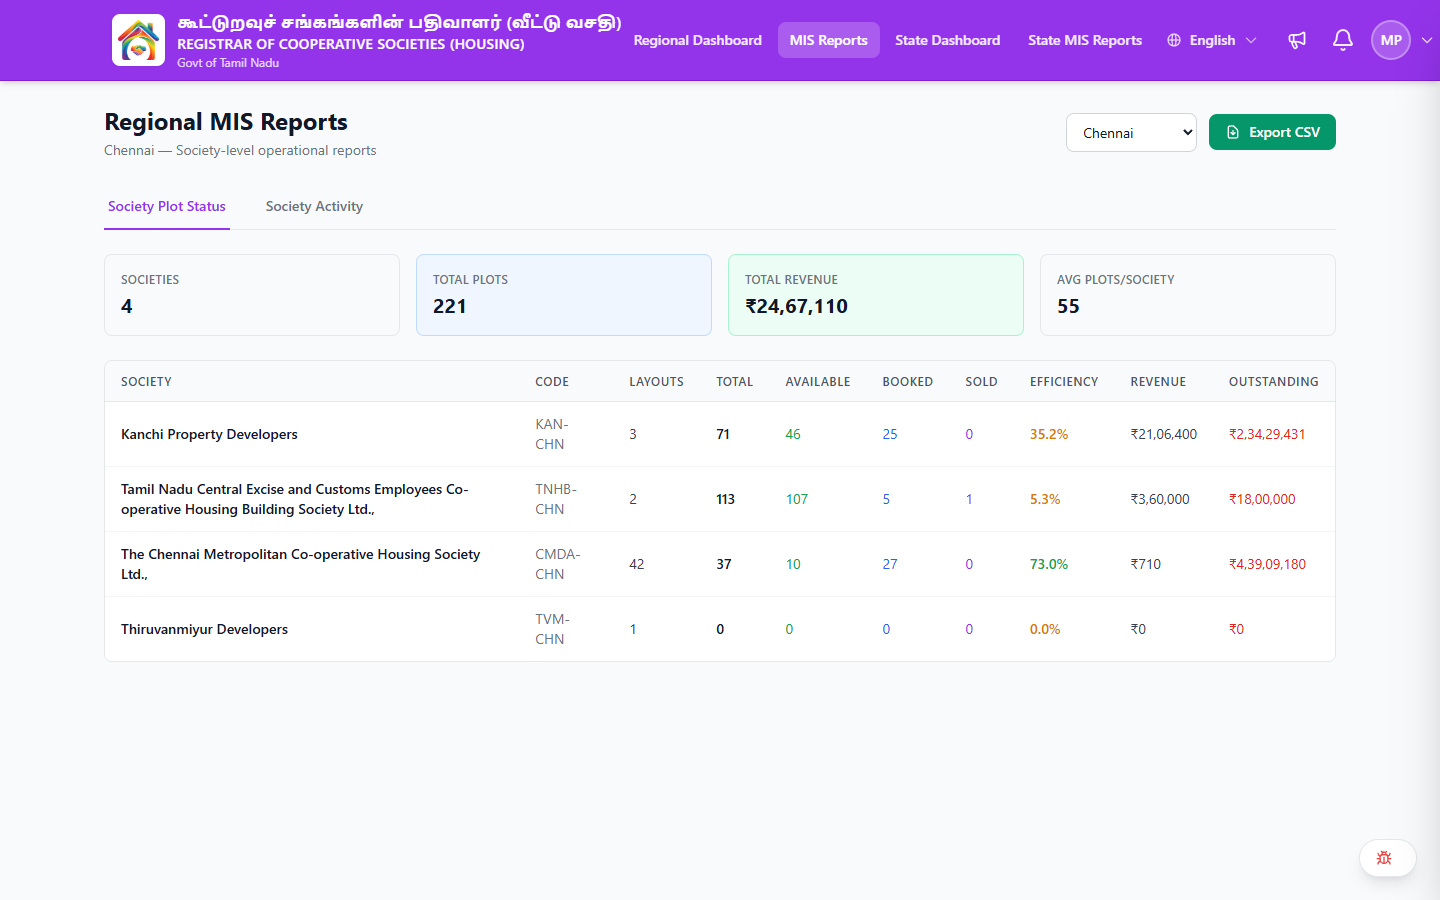
At the top of every tab, four summary cards display the selected region's totals:
| Card | Description | Example |
|---|---|---|
| Societies | Number of societies in the region | 4 |
| Total Plots | Total plots across all societies | 221 |
| Total Revenue | Total revenue for the region | ₹24,67,110 |
| Avg Plots/Society | Average plot count per society | 55 |
Data Table
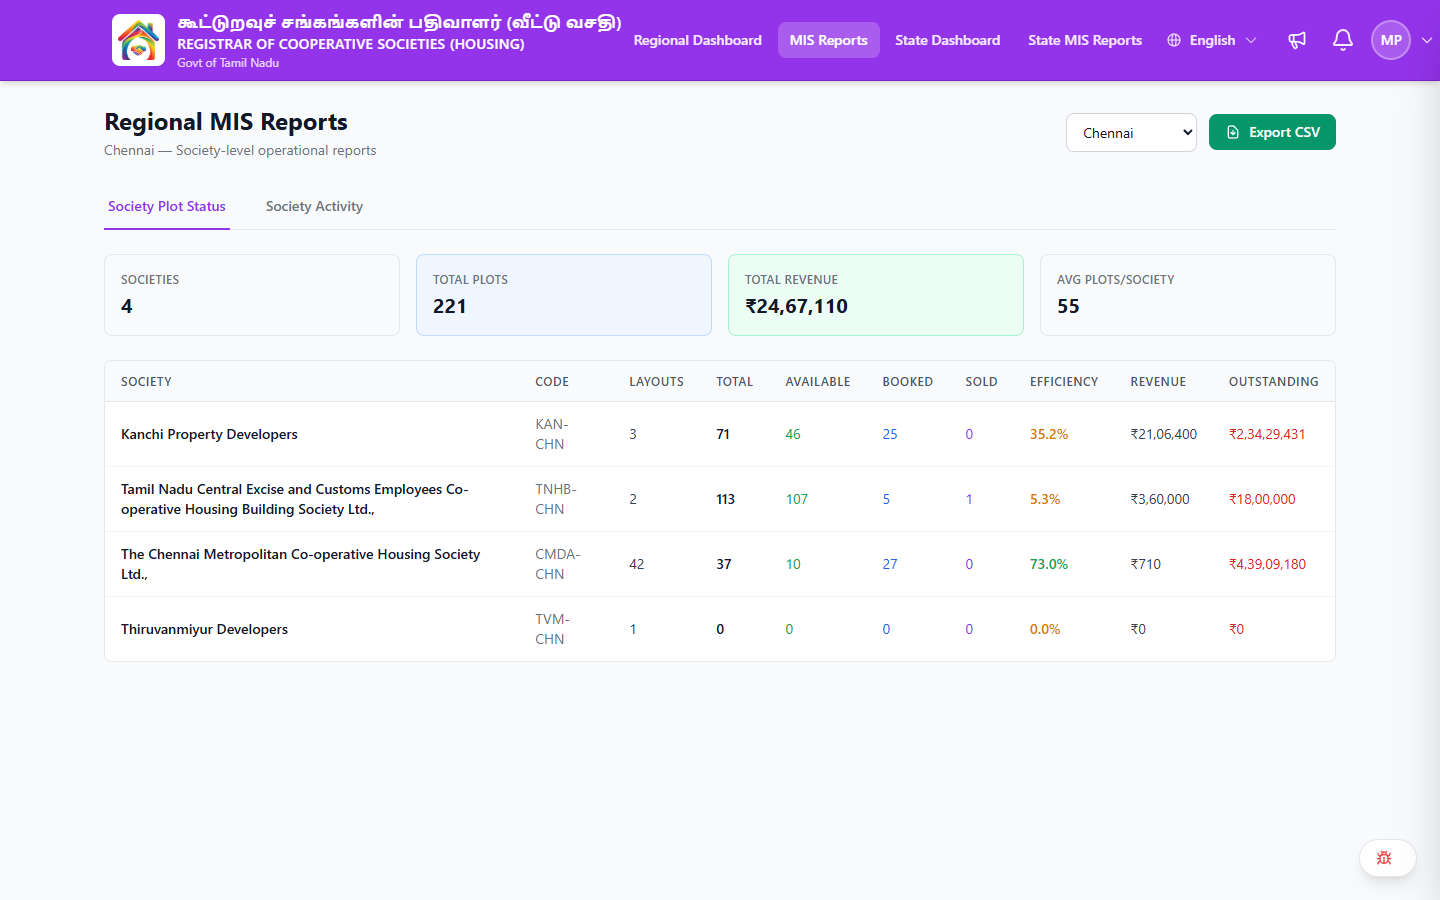
The main table shows one row per society:
| Column | Description |
|---|---|
| Society | Society name |
| Code | Society short code (e.g., KAN-CHN, CMDA-CHN) |
| Layouts | Number of layouts |
| Total | Total plots |
| Available | Available plots |
| Booked | Booked plots |
| Sold | Sold plots |
| Efficiency | Booking efficiency percentage |
| Revenue | Total revenue collected |
| Outstanding | Outstanding amount due |
Exporting Data
- Select the desired region from the dropdown
- Select the desired tab
- Click the Export CSV button
- The CSV file includes all columns for the selected region's societies
Using Regional MIS Reports
Quick Region Overview
- Select a region from the dropdown
- Summary cards show: total societies, plots, revenue, and average plots per society
- Table shows each society's detailed performance and outstanding amounts
Comparing Societies Within a Region
| What to Compare | How |
|---|---|
| Efficiency | Sort by Efficiency column — highest and lowest performers |
| Revenue | Compare Revenue column across societies |
| Outstanding | High outstanding with low revenue means collection issues |
| Scale | Compare Total plots and Layouts count |
Cross-Region Comparison
- Select one region, note the key metrics
- Switch to another region using the dropdown
- Compare the same metrics
- For a faster cross-region view, use State MIS Reports instead
Common Scenarios
"I need society-level performance data for a specific region"
- Navigate to MIS Reports (Top Navbar → MIS Reports)
- Select the region from the dropdown
- View the Society Plot Status tab for plot and revenue data
- Click Export CSV if you need the data in a spreadsheet
"Which societies have the most outstanding revenue?"
- Select the region
- Check the Outstanding column in the table
- Societies with high outstanding relative to revenue need collection follow-up
- Use the Regional Dashboard to investigate further by clicking View on the society
"I need to compare societies across two regions"
- View MIS Reports for the first region → note or export the data
- Switch the region dropdown to the second region
- Compare the same metrics
- Alternatively, export both CSVs and combine them in a spreadsheet
Related Pages
- State MIS Reports — State-wide region-level MIS data
- Regional Oversight — Regional Dashboard with KPAs and trends
- State Dashboard — State-wide overview
- State Financial Reports — Financial data overview