State Dashboard
Role Required: STATE_ADMIN
Navigation: Top Navbar → State Dashboard
Route:/admin/state-dashboard
Last Updated: March 2026 | Portal Version: 1.0
Overview
The State Dashboard provides an executive-level view of the entire platform. It aggregates data across all regions and societies, showing KPAs, a regional performance comparison table, booking and collection trends, target trackers, policy compliance status, performance leaders, alerts, and website visitor statistics.
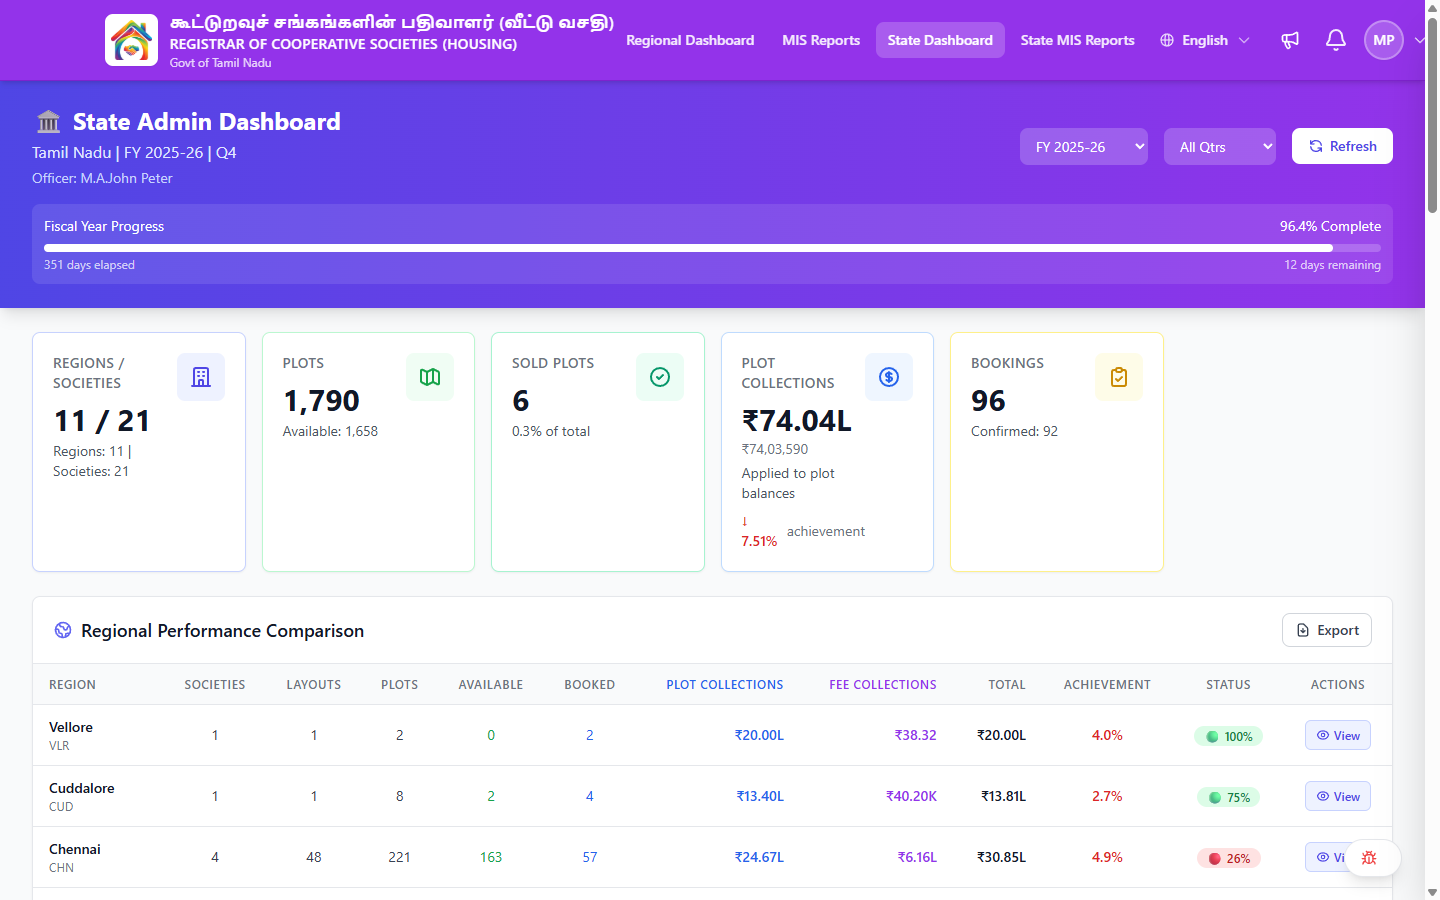
Dashboard Header
The header displays:
- Title: 🏛️ State Admin Dashboard
- Subtitle: State name, fiscal year, and quarter (e.g., "Tamil Nadu | FY 2025-26 | Q4")
- Officer: The logged-in State Admin's name
Filters
| Filter | Options | Default |
|---|---|---|
| Fiscal Year | Dropdown of available fiscal years | Current FY (e.g., 2025-26) |
| Quarter | All Qtrs, Q1, Q2, Q3, Q4 | All Qtrs |
| Refresh | Button to reload dashboard data | — |

Fiscal Year Progress
A progress bar showing how far along the current fiscal year is:
| Element | Example |
|---|---|
| Percentage | 96.4% Complete |
| Days Elapsed | 351 days |
| Days Remaining | 12 days |

KPA Summary Cards
Five key performance cards displayed at the top of the dashboard:
| Card | Main Value | Subtitle/Detail |
|---|---|---|
| Regions / Societies | Count of regions / societies (e.g., 11 / 21) | — |
| Plots | Total plot count (e.g., 1,790) | Available count (e.g., "Available: 1,658") |
| Sold Plots | Sold plot count (e.g., 6) | Percentage of total (e.g., "0.3%") |
| Plot Collections | Total collections amount (e.g., ₹74.04L) | Trend vs last month (e.g., "↓ 7.51%") |
| Bookings | Total bookings (e.g., 96) | Confirmed count (e.g., "Confirmed: 92") |

Regional Performance Comparison
A table comparing all regions under the state. Each row shows a region's key metrics with a View button to drill into that region's dashboard.
| Column | Description |
|---|---|
| Region | Region name and short code |
| Societies | Number of societies |
| Layouts | Number of layouts |
| Plots | Total plots |
| Available | Available plots |
| Booked | Booked plots |
| Plot Collections | Revenue from plot payments |
| Fee Collections | Revenue from fees |
| Total | Combined revenue |
| Achievement | Achievement percentage |
| Status | 🟢 (good) / 🔴 (needs attention) with percentage |
| Actions | View button — opens the Regional Dashboard for that region |
The table footer shows a STATE TOTAL row aggregating all regions.
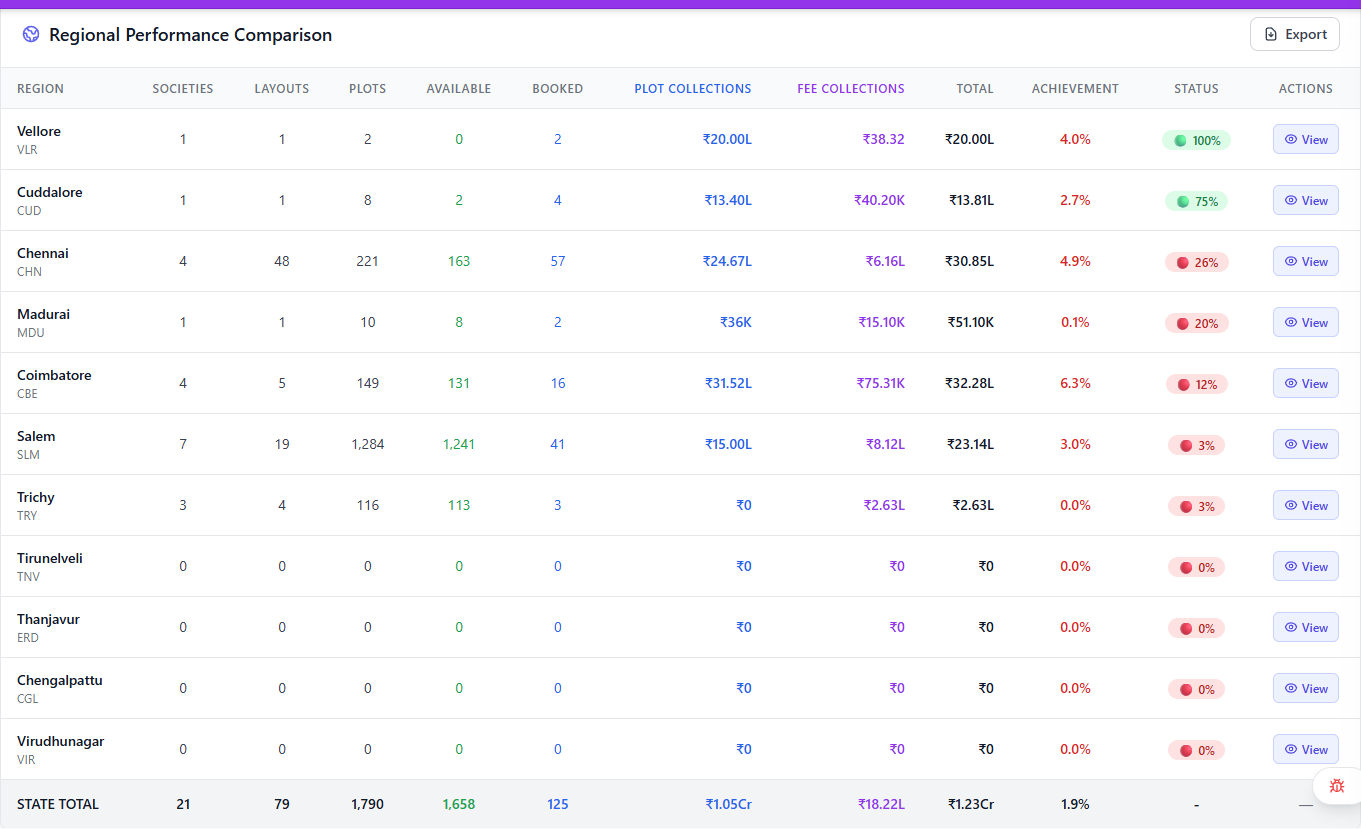
Click the View button on any region row to open the Regional Dashboard pre-filtered to that region. From there you can see society-level details, trends, and more.
State-Wide Trends
Two charts showing 12-month trends across the entire state:
Booking Trends (Last 12 Months)
- Bookings — current year monthly bookings
- Previous Year — same months from the prior year
- Target — monthly target line
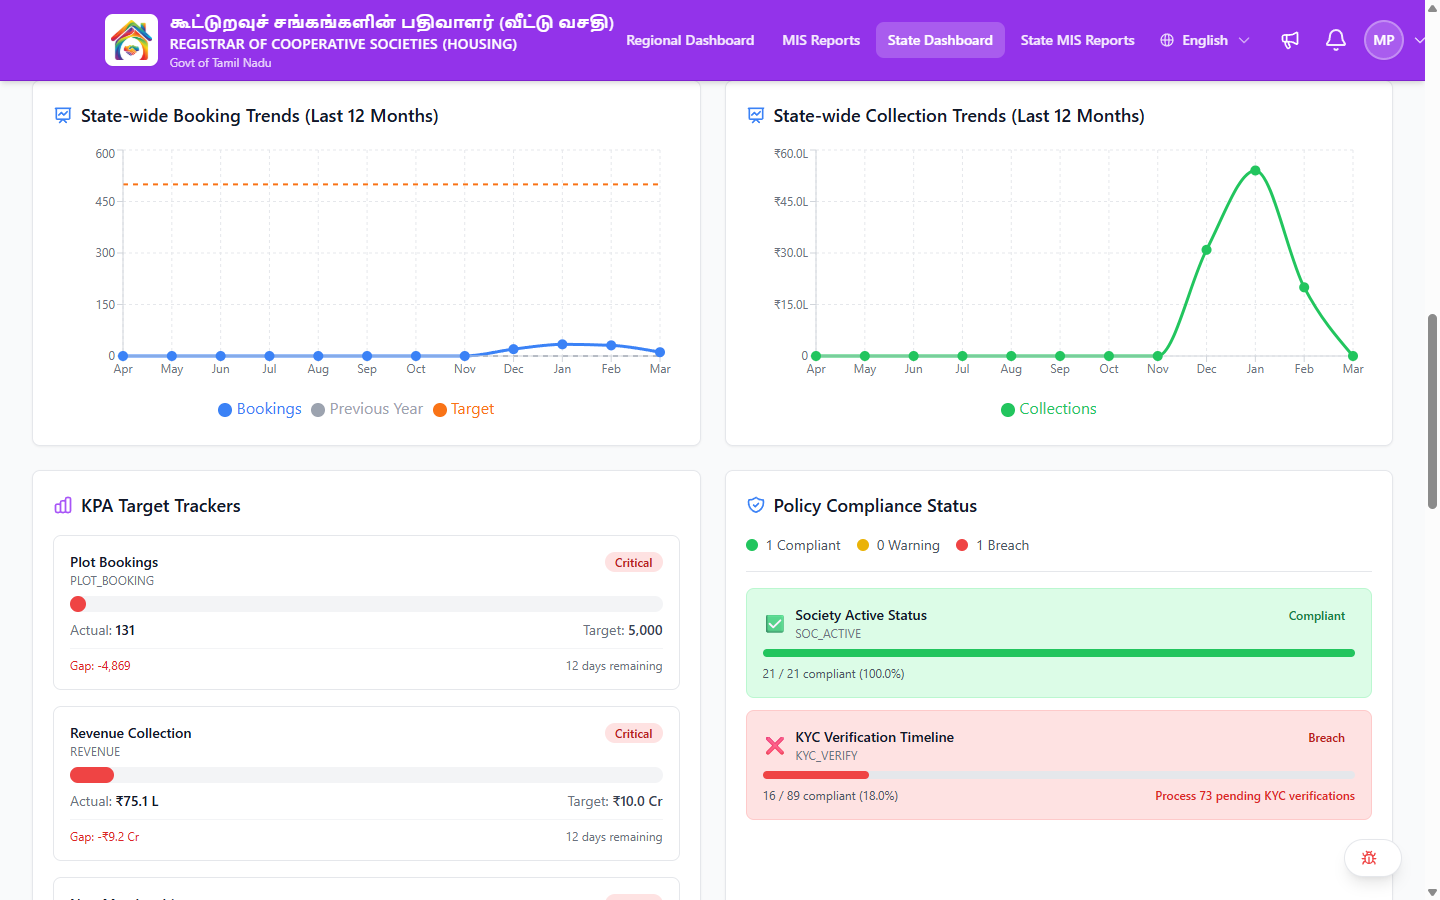
Collection Trends (Last 12 Months)
- Collections — monthly collection amounts
KPA Target Trackers
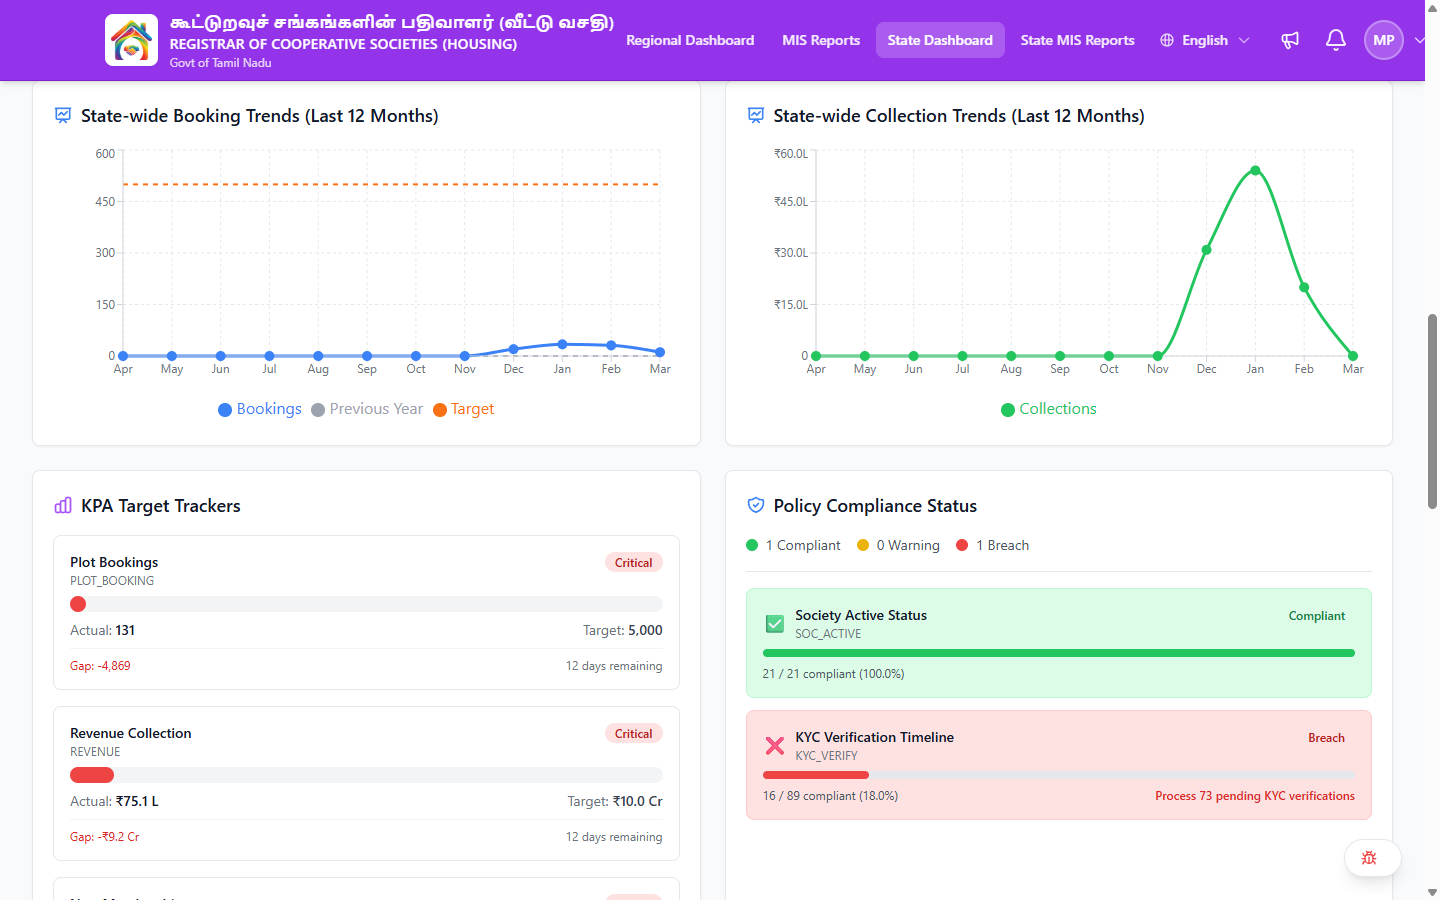
Track KPA targets against actual achievement for the current fiscal year/quarter:
| Element | Description |
|---|---|
| KPA Name | The metric being tracked (e.g., Plot Bookings, Revenue Collection, New Memberships) |
| Code | Internal KPA code (e.g., PLOT_BOOKING, REVENUE, MEMBERSHIP) |
| Status | Critical / At Risk / On Track |
| Actual | Current achievement value |
| Target | Goal for the period |
| Gap | Difference between actual and target |
| Time Remaining | Days left in the period |
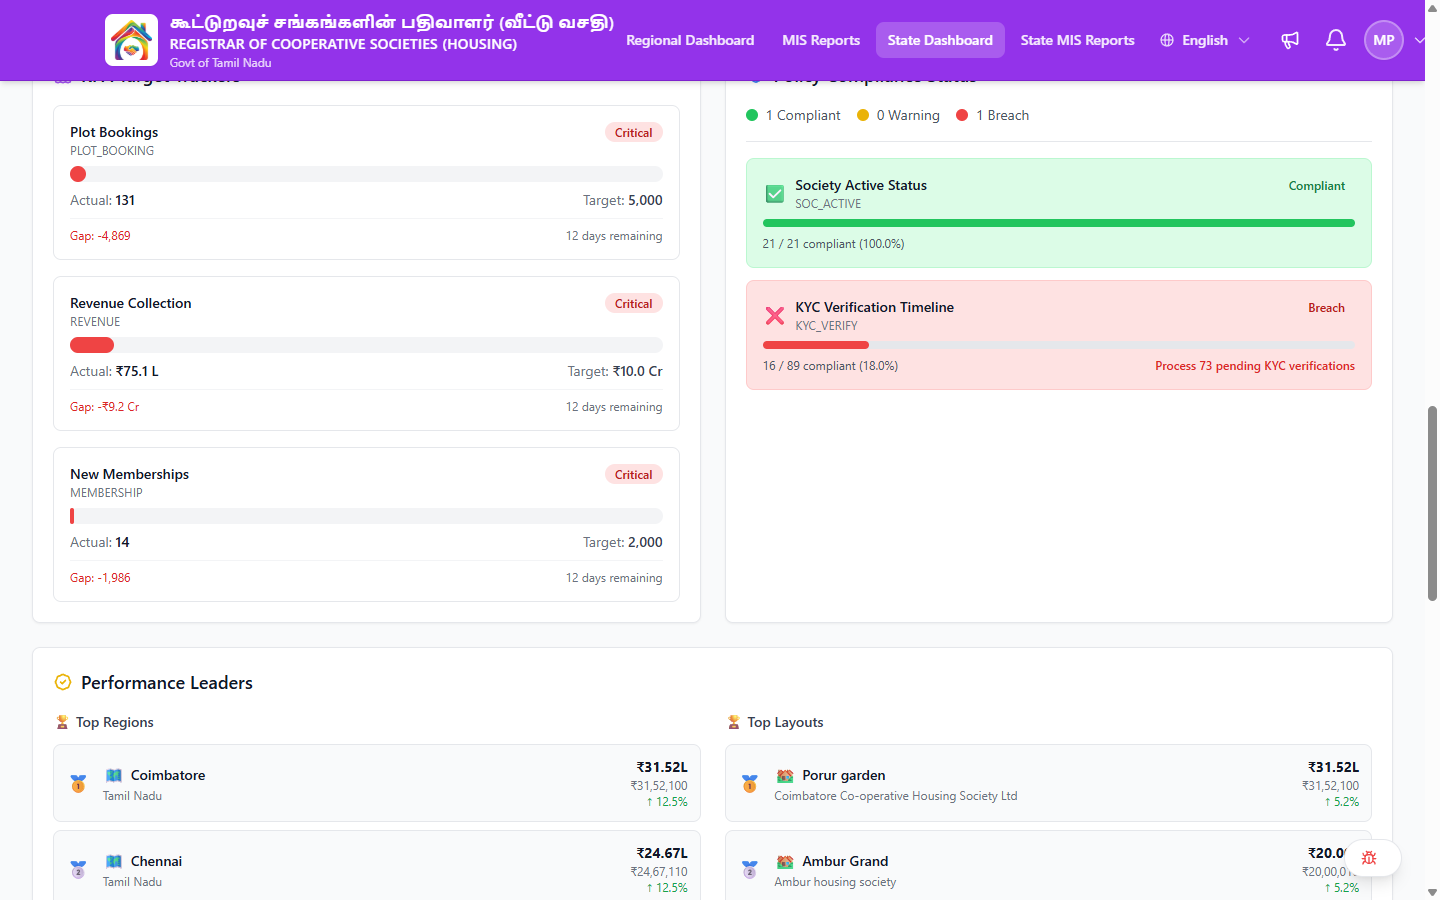
Policy Compliance Status
A summary of platform-wide policy compliance with a breakdown by policy area:
Summary Bar
| Indicator | Meaning |
|---|---|
| Compliant | Number of policies fully met |
| Warning | Policies at risk |
| Breach | Policies not being met |
Policy Areas
Each policy area shows:
- Policy Name and code (e.g., "Society Active Status" / SOC_ACTIVE)
- Status: ✅ Compliant or ❌ Breach
- Compliance Rate: e.g., "21 / 21 compliant (100.0%)"
- Action Required (if breach): e.g., "Process 73 pending KYC verifications"
Click on a policy area to expand details.
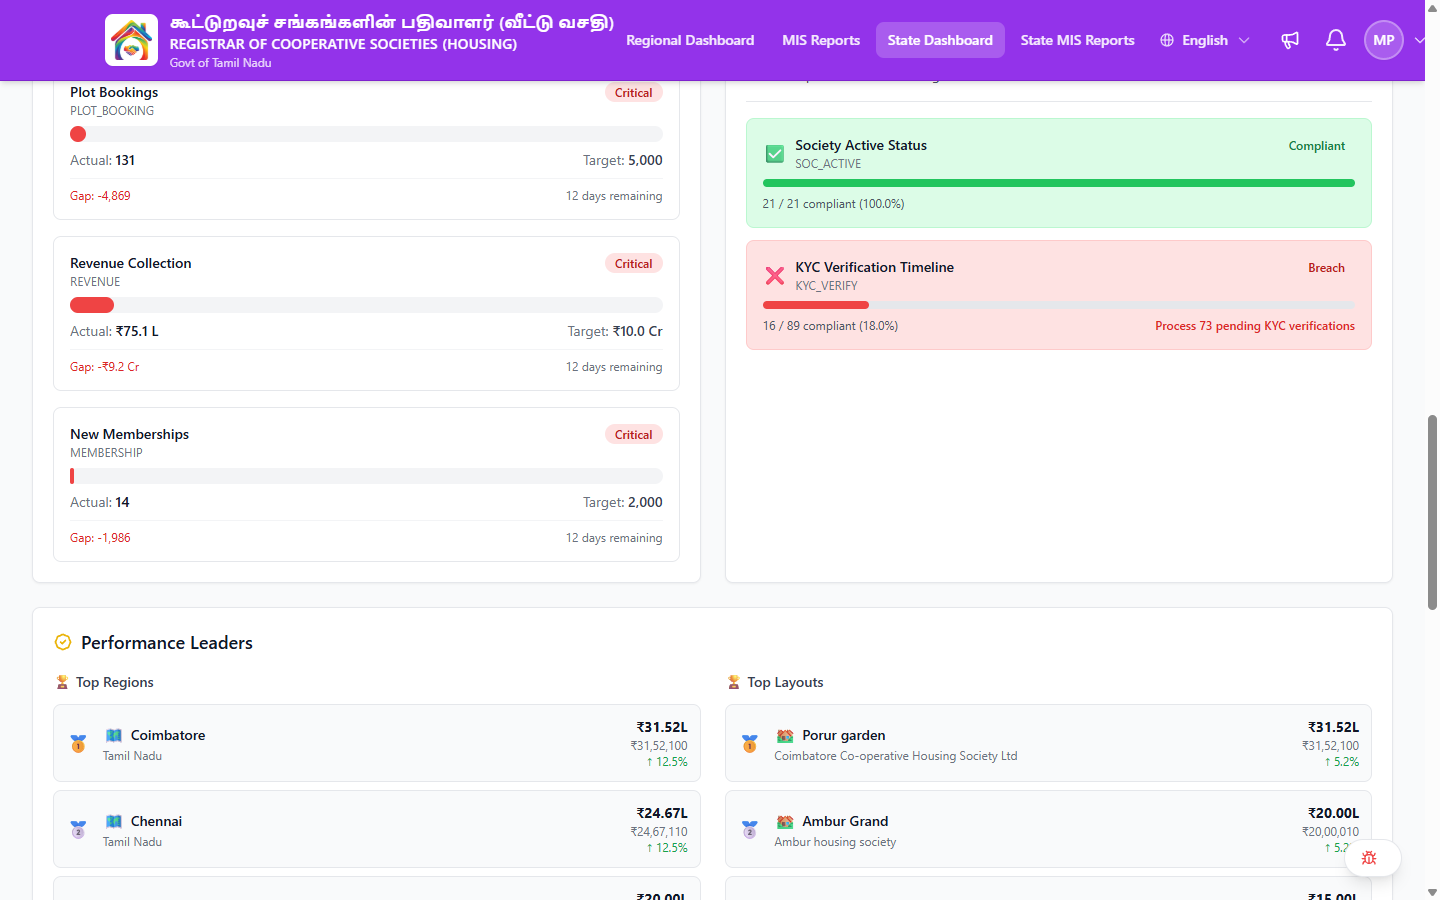
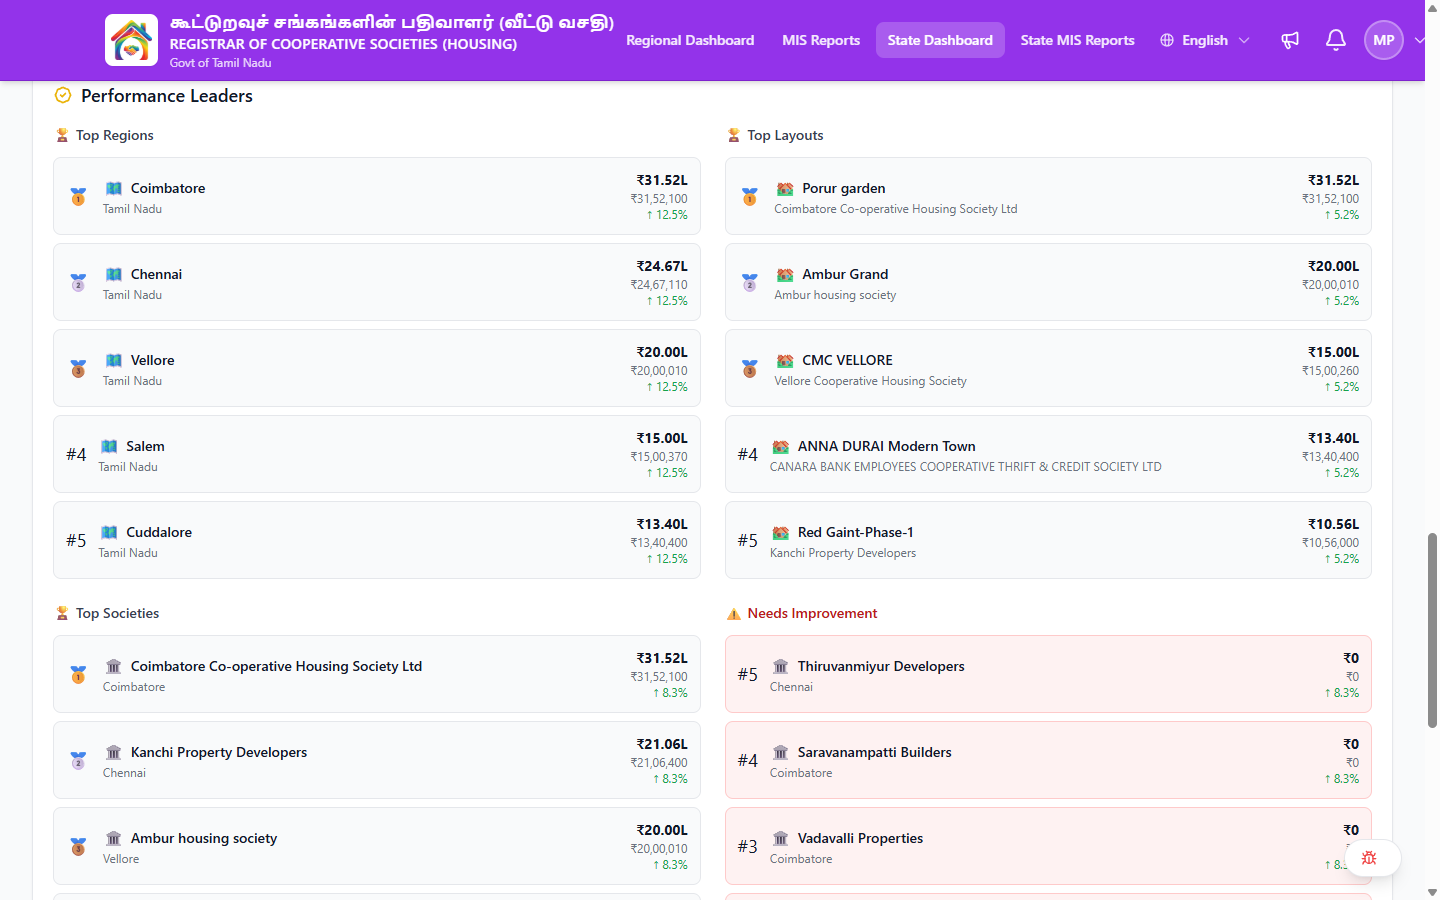
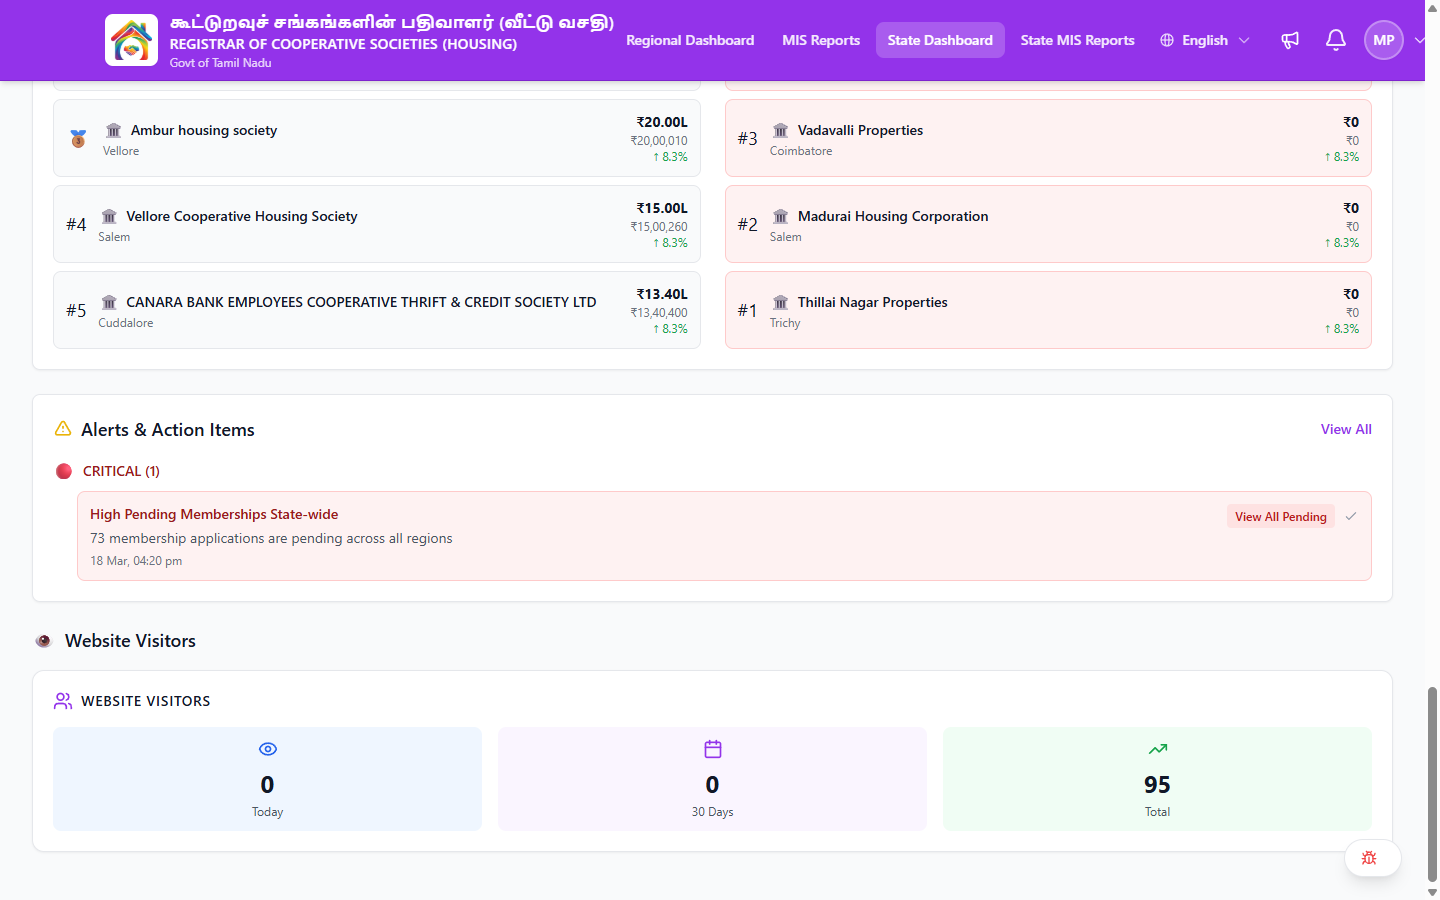
Performance Leaders
Rankings showing the top performers and entities needing improvement:
| Section | Shows Top 5 |
|---|---|
| 🏆 Top Regions | Highest-earning regions by total revenue, with amount and growth % |
| 🏆 Top Societies | Highest-earning societies with parent region |
| 🏆 Top Layouts | Best-performing layouts with parent society |
| ⚠️ Needs Improvement | Lowest-performing societies needing intervention |
Each entry is clickable for further details.
Alerts & Action Items
Alerts escalated to the state level, grouped by severity:
| Severity | Description |
|---|---|
| 🔴 CRITICAL | Requires immediate state-level intervention |
| 🟡 WARNING | Needs review and potential action |
| ℹ️ INFO | Informational — no immediate action required |
Each alert shows:
- Title — what the alert is about
- Description — details and affected count
- Timestamp — when the alert was generated
- Actions — e.g., "View All Pending", "Acknowledge"
Click View All to see all alerts. Click Acknowledge to mark an alert as reviewed.
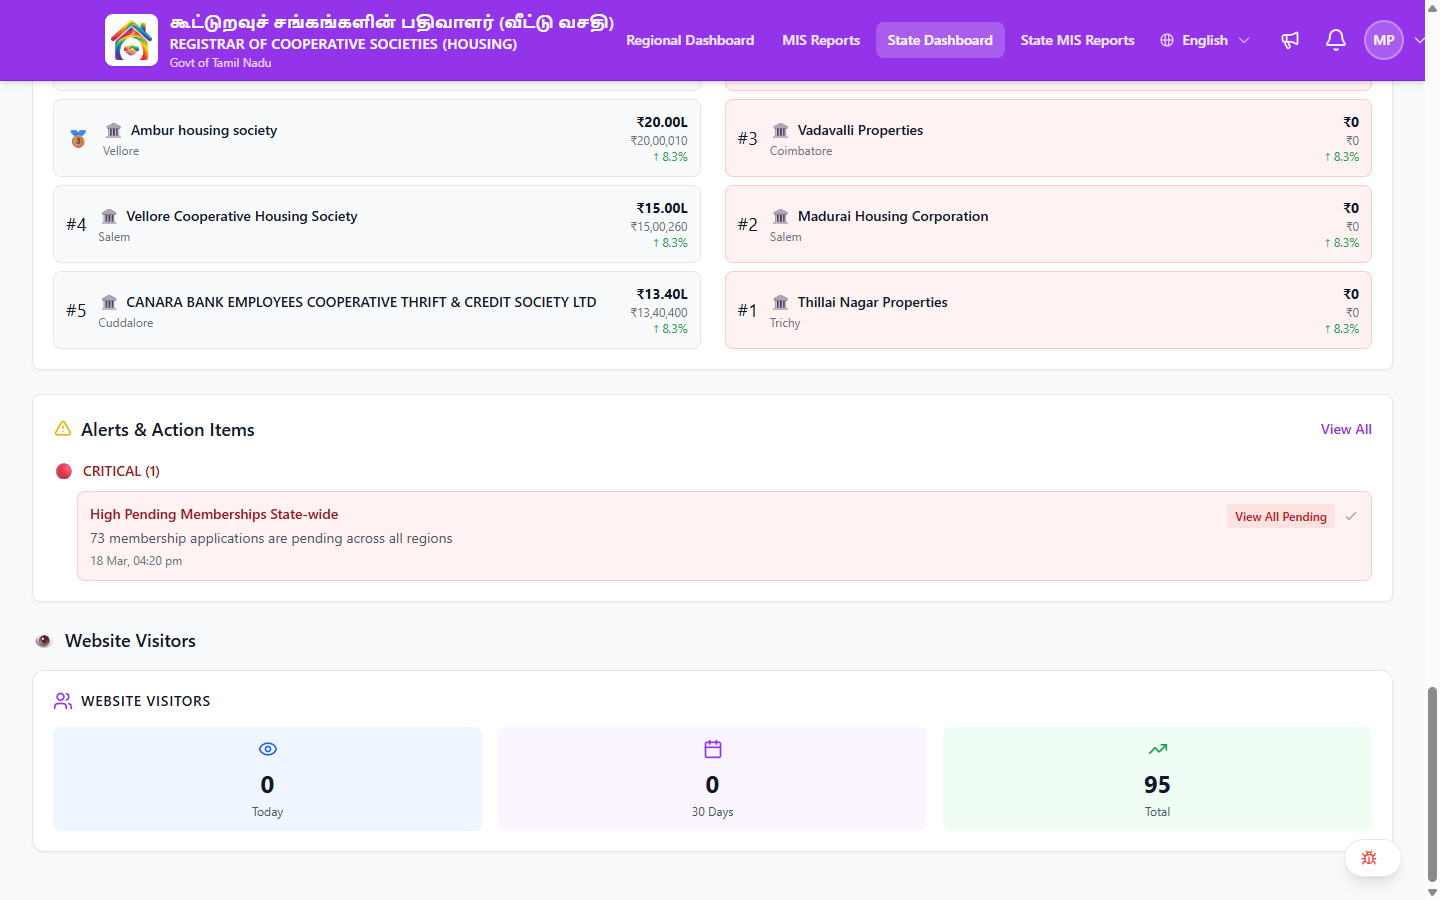
Website Visitors
A summary of website visitor statistics:
| Metric | Description |
|---|---|
| Today | Visitors today |
| 30 Days | Visitors in the last 30 days |
| Total | All-time visitor count |
Using the Dashboard
Executive Morning Review
- Check Alerts & Action Items — any critical items requiring immediate attention?
- Scan KPA Summary Cards — are key numbers healthy?
- Review the Regional Performance Table — any region showing 🔴 status?
- Check KPA Target Trackers — any KPA showing "Critical"?
Quarterly Review
- Set the quarter filter to the target quarter
- Review all target trackers against goals
- Identify top and bottom performers in the Performance Leaders section
- Check Policy Compliance across all policies
- Analyze 12-month trend charts for long-term trajectory
- Click View on underperforming regions for deeper analysis
Common Scenarios
"Which region needs the most support?"
Look at the Regional Performance Comparison table — regions with 🔴 status and low achievement percentage need attention. Cross-reference with KPA Target Trackers to see which specific goals are falling behind.
"We need to present performance to the board"
- Set fiscal year and quarter filters
- Capture:
- KPA Summary Cards
- Regional Performance Comparison table
- Target Trackers (with gap values)
- Performance Leaders (Top Regions, Top Societies)
- Trend charts for year-over-year comparison
- Use Export CSV from the State MIS Reports for detailed data
"A critical alert was escalated — what's my role?"
- Read the alert details in the Alerts & Action Items section
- Click the action button (e.g., "View All Pending") to see affected items
- Click View on the affected region in the performance table
- Contact the Regional Admin for context
- Make a decision: take state-level action or delegate back with instructions
- Click Acknowledge to mark the alert as reviewed
Related Pages
- Regional Oversight — Drill into specific regions via the Regional Dashboard
- State MIS Reports — Detailed state-wide MIS reports
- Regional MIS Reports — Society-level MIS reports by region
- Policy & Compliance — Compliance monitoring details
- Audit & Escalations — Alert and escalation management