Society View (Read-Only)
Role Required: REGIONAL_ADMIN
Navigation: Regional Dashboard → Society Performance Table → View button
Route:/admin/societies/:id?from=regional
Last Updated: March 2026 | Portal Version: 1.0
Overview
The Society View page lets you drill into a specific society within your region. You can see its KPAs, booking and collection trends, and browse society data (layouts, plots, members, collections). Everything on this page is read-only — indicated by a "View Only" badge next to the society name.
How to Access
- From the Regional Dashboard, scroll to the Society-wise Performance table
- Find the society you want to inspect
- Click the View button in the Actions column
- The Society View page opens with a "← Back to Regional Dashboard" link at the top
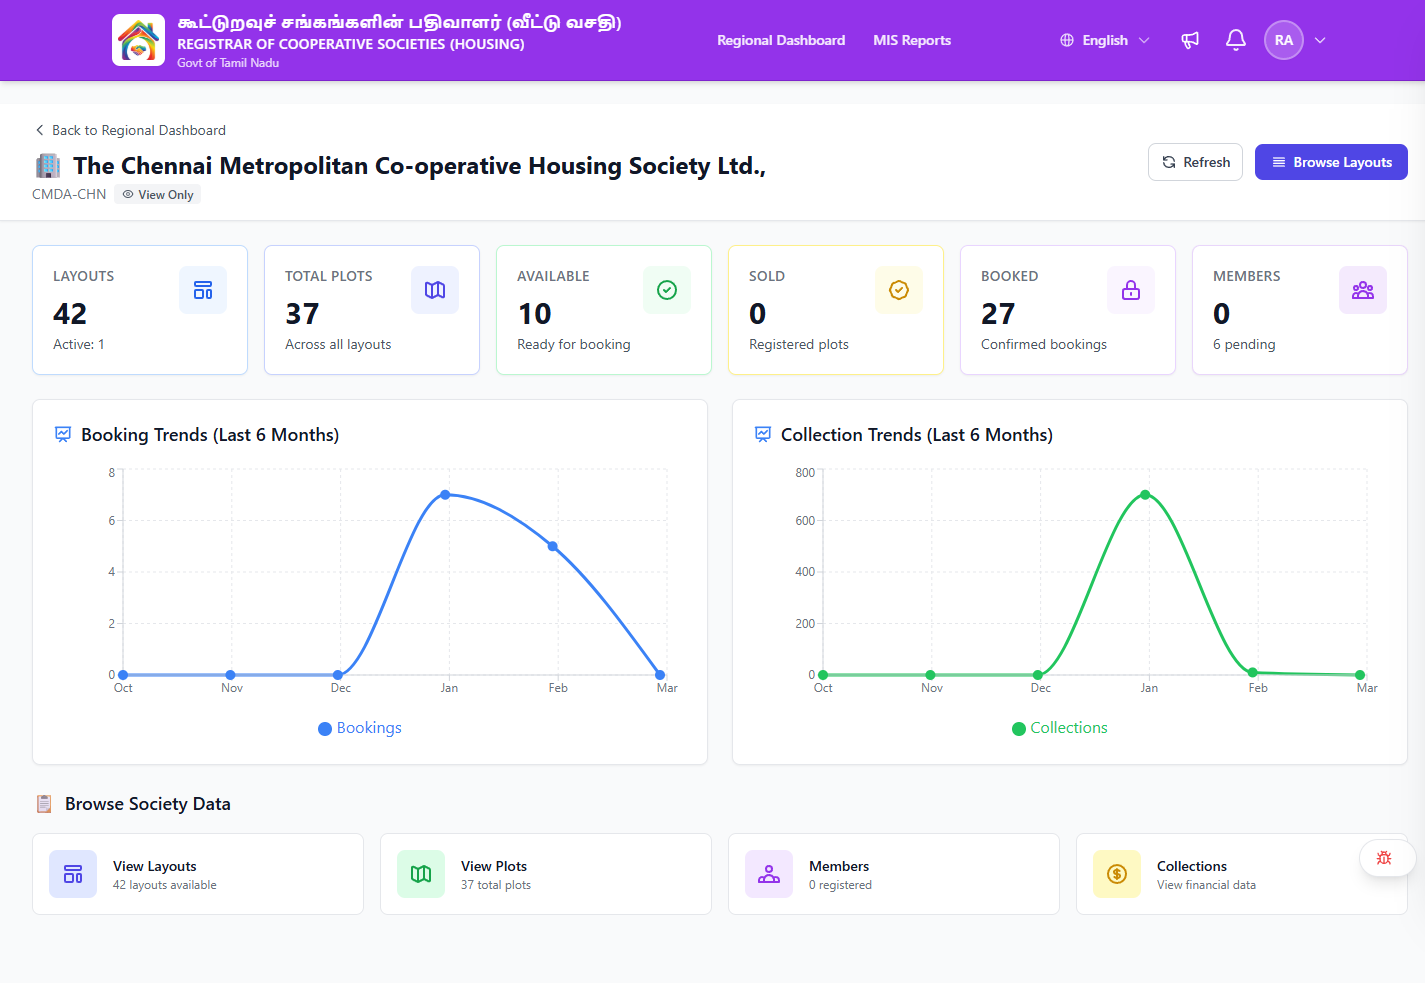
Page Header
| Element | Description |
|---|---|
| Back button | "Back to Regional Dashboard" button — returns to the dashboard |
| Society Name | Full name of the society with 🏢 icon (e.g., "🏢 The Chennai Metropolitan Co-operative Housing Society Ltd.,") |
| Society Code | Code displayed below the name (e.g., "CMDA-CHN") |
| View Only badge | Badge with lock icon confirming read-only access |
| Refresh button | Re-fetches society data |
| Browse Layouts button | Shortcut to navigate directly to the society's layouts page |
KPA Summary Cards
Six cards display the society's key performance indicators. The Layouts and Total Plots cards are clickable.
| Card | Subtitle | Example | Clickable |
|---|---|---|---|
| Layouts | "Active: X" | 42 (Active: 1) | ✅ |
| Total Plots | "Across all layouts" | 37 | ✅ |
| Available | "Ready for booking" | 10 | — |
| Sold | "Registered plots" | 0 | — |
| Booked | "Confirmed bookings" | 27 | — |
| Members | "X pending" | 0 (6 pending) | — |

Trend Charts
Two charts display the society's performance over time:
Booking Trends
A bar chart showing monthly booking counts. Each bar represents the total number of bookings for that month. The chart includes month labels on the X-axis and count on the Y-axis.
Collection Trends
A bar chart showing monthly collection amounts (in INR). Each bar represents the total collections received for that month. Hover over a bar to see the exact amount.

Browse Society Data
Below the trend charts, a "📋 Browse Society Data" section provides four cards. The first two are clickable navigation buttons; the remaining two are informational display cards.
| Card | Subtitle | Clickable | Navigates To |
|---|---|---|---|
| View Layouts | "X layouts available" | ✅ Button | /admin/societies/:id/layouts — Society Layouts page |
| View Plots | "X total plots" | ✅ Button | Plot listing page (read-only) |
| Members | "X registered" | — Display only | — |
| Collections | "View financial data" | — Display only | — |
Each card shows an icon, title, and a count or description.

All data in Browse Society Data sections is read-only. You can view and browse records but cannot create, edit, or delete any society data.
What to Look For
Healthy Society Indicators
| Indicator | Healthy Sign |
|---|---|
| Booking rate | Steady or increasing |
| Available plots | Balanced — not sitting unsold for long |
| Collection trend | Increasing or stable |
| Member count | Growing relative to bookings |
Warning Signs
| Warning | What It Means |
|---|---|
| Declining bookings | Marketing, pricing, or inventory issue |
| High Available but low Booked | Low demand or stale inventory |
| Flat or declining Collections | Payment compliance problem |
| No recent activity | Society may be inactive or admin absent |
Taking Action
As a Regional Admin, you have read-only access to society data. If you spot issues:
| If You See | Action |
|---|---|
| Declining society performance | Contact the Society Admin for explanation |
| Financial irregularities | Create an escalation to the Super Admin |
| Stale inventory (high Available plots) | Discuss pricing or marketing with the Society Admin |
| No recent activity | Check if the Society Admin is active |
Common Scenarios
"I want to check if a society is on track this month"
- From the Regional Dashboard, click View on that society
- Check the KPA cards for current inventory status
- Review the Booking Trends chart for this month's pattern
- Review the Collection Trends chart for payment inflow
- Compare against previous months to identify any drops
"I want to see the layouts and plots for a specific society"
- Open the Society View for that society
- Scroll to the Browse Society Data section
- Click View Layouts to see all layouts with plot counts and status
- Click View Plots for a flat list of all plots
"I need to report on an underperforming society"
- Open the Society View page
- Note the KPA values (Total Plots, Available, Sold, Booked)
- Screenshot the trend charts showing the decline pattern
- Check the Members count and recent Collections
- Include this data in your report to the Super Admin
Related Pages
- Regional Dashboard — Region-level overview
- Society Layouts — Browse a society's layouts and plot info
- MIS Reports — Aggregate society reports with CSV export