Regional MIS Reports
Role Required: REGIONAL_ADMIN
Navigation: Top navbar → MIS Reports (also: Dashboard → Quick Actions → MIS Reports)
Route:/admin/regional-mis-reports
Last Updated: March 2026 | Portal Version: 1.0
Overview
The Regional MIS (Management Information System) Reports page provides society-level operational data for your region. It offers two report views — Society Plot Status and Society Activity — with the ability to export data as CSV files.
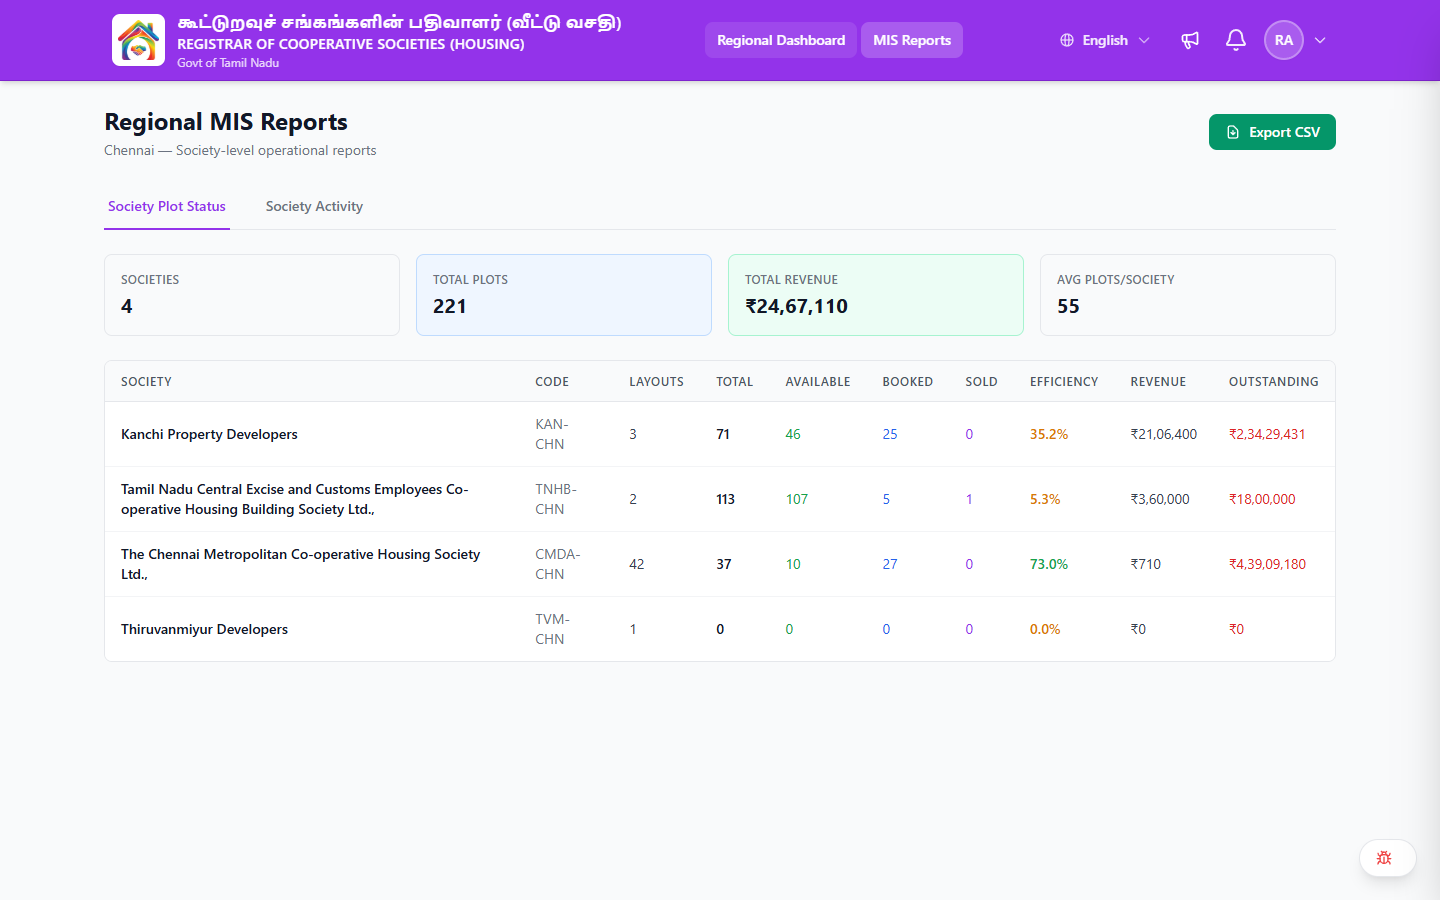
The page header shows the title "Regional MIS Reports" with a subtitle displaying your region name followed by "Society-level operational reports" (e.g., "Chennai — Society-level operational reports").
Export CSV
A single Export CSV button in the top-right corner exports data from whichever tab is currently active.
- Plot Status tab → exports
regional-society-plot-status.csv - Activity tab → exports
regional-society-activity.csv
The button is disabled while data is loading.
Tab 1: Society Plot Status
This tab shows plot inventory and revenue metrics for each society in your region.
Summary Cards
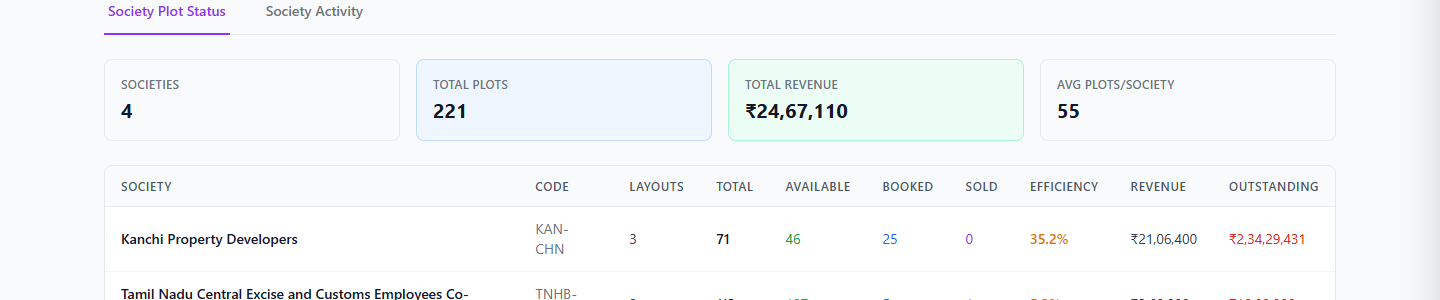
Four summary cards appear at the top:
| Card | Description |
|---|---|
| Societies | Total number of societies in your region |
| Total Plots | Aggregate plots across all societies |
| Total Revenue | Total revenue in INR (₹) across the region |
| Avg Plots/Society | Average number of plots per society (rounded) |

Plot Status Table
| Column | Description | Formatting |
|---|---|---|
| Society | Society name | Bold |
| Code | Society code (e.g., CMDA-CHN) | Gray text |
| Layouts | Number of active layouts | — |
| Total | Total number of plots | Bold |
| Available | Plots available for booking | Green text |
| Booked | Confirmed bookings | Blue text |
| Sold | Fully registered plots | Purple text |
| Efficiency | Sales efficiency percentage (Booked ÷ Total) | Green if ≥50%, amber if <50% |
| Revenue | Total revenue for the society | INR currency (₹, no decimals) |
| Outstanding | Outstanding payment amount | Red text, INR currency |
CSV Export Columns (Plot Status)
Society, Code, Layouts, Total Plots, Available, Booked, Sold, Efficiency, Revenue, Outstanding
Tab 2: Society Activity
This tab shows booking and financial activity for each society over a selected date range.
Summary Cards
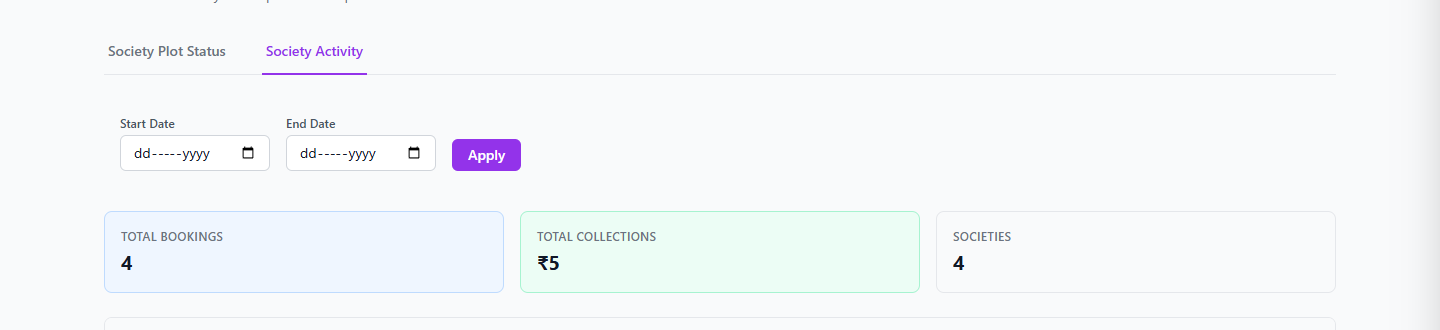
Three summary cards appear at the top:
| Card | Description |
|---|---|
| Total Bookings | Aggregate bookings across all societies |
| Total Collections | Total collections in INR (₹) |
| Societies | Number of societies in the region |
Date Filters
A filter bar with:
| Filter | Type | Description |
|---|---|---|
| Start Date | Date input | Beginning of the reporting period |
| End Date | Date input | End of the reporting period |
| Apply | Button | Applies the selected date range |
Data is automatically scoped to all societies in your region. No society-specific filter is available.

Activity Table
| Column | Description | Formatting |
|---|---|---|
| Society | Society name | Bold |
| Code | Society code | Gray text |
| Bookings | Number of bookings in the period | — |
| Sold | Number of sold/completed bookings | — |
| Refund | Number of refunded/cancelled bookings | — |
| Collections | Collections received | INR currency |
| Refunds | Refunds processed | INR currency |
| Receipts | Number of payment receipts | — |
| Last Activity | Date of most recent activity | DD Mon YYYY format, or "—" if none |
CSV Export Columns (Activity)
Society, Code, Bookings, Sold, Refund, Collections, Refunds, Receipts
The Last Activity column is displayed in the table but is not included in the CSV export.
Step-by-Step: Exporting a Monthly Activity Report
- Navigate to MIS Reports from the top navbar link, Quick Actions, or via
/admin/regional-mis-reports - Click the Society Activity tab
- Set the Start Date to the first day of the month
- Set the End Date to the last day of the month
- Click Apply to filter the data
- Review the table and summary cards
- Click Export CSV to download the report
Common Scenarios
"I need a snapshot of plot availability across all societies"
- Open MIS Reports
- Stay on the Society Plot Status tab (default)
- Review the table for Available, Booked, and Sold counts per society
- Click Export CSV for an offline copy
"Which society had the most cancellations this month?"
- Switch to the Society Activity tab
- Set the date range to the current month
- Click Apply
- Look at the Cancelled column — the highest number indicates the most cancellations
- Investigate further by viewing that society's dashboard
Related Pages
- Regional Dashboard — Main dashboard with KPAs and performance overview
- Society View — Drill-down into a specific society