Regional Dashboard
Role Required: REGIONAL_ADMIN
Navigation: Top navbar → Regional Dashboard (also: MIS Reports link in navbar)
Route:/admin/regional-dashboard
Last Updated: March 2026 | Portal Version: 1.0
Overview
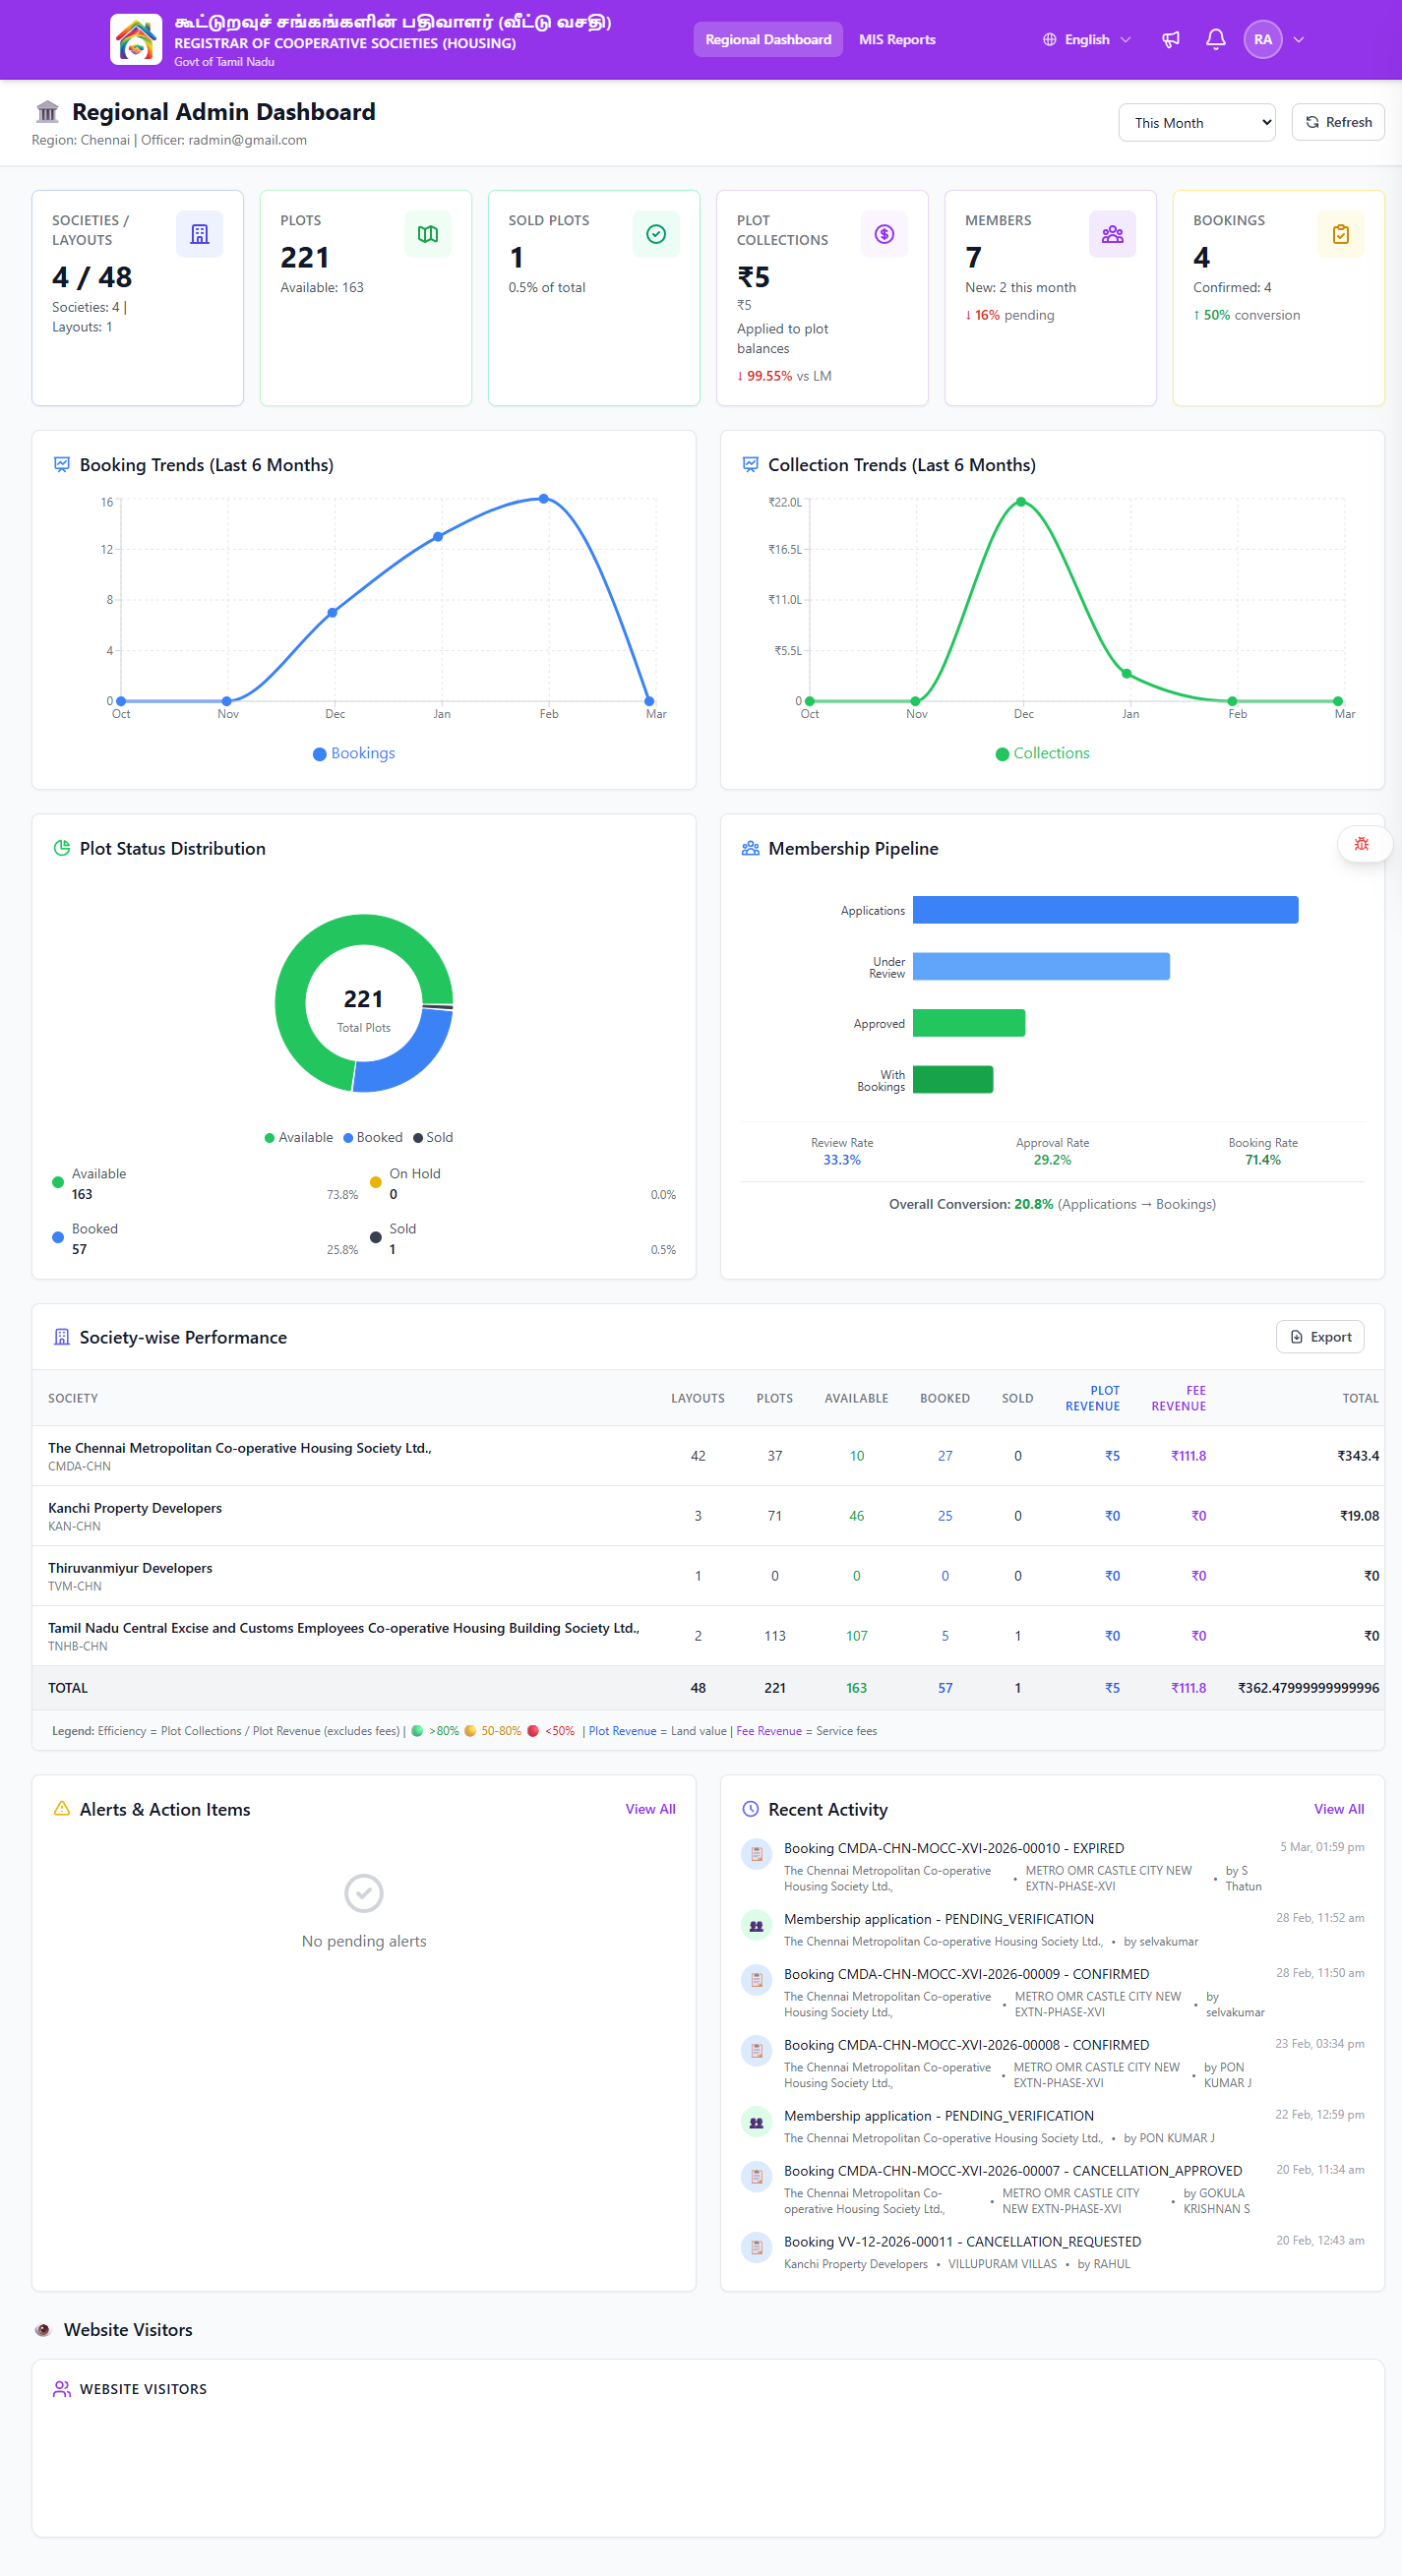
The Regional Dashboard is your primary monitoring interface. It aggregates data from all societies in your assigned region — displaying KPA summary cards, society-wise performance table, trend charts, plot status distribution, membership pipeline, alerts, recent activities, website visitor stats, and quick actions.
The page header shows the dashboard title ("🏛️ Regional Admin Dashboard") along with your region name and officer identity (e.g., "Region: Chennai | Officer: radmin@gmail.com").
Time Period Filter
At the top-right of the dashboard, a dropdown lets you filter all dashboard data by time period:
| Option | Description |
|---|---|
| Today | Data for today only |
| This Week | Current week's data |
| This Month | Current month's data (default) |
| All Time | No time restriction |
A Refresh button next to the dropdown re-fetches all dashboard data.
Dashboard Sections
1. KPA Summary Cards
Six summary cards across the top showing key metrics for your region:
| KPA Card | Example Value | Description |
|---|---|---|
| Societies / Layouts | 4 / 48 | Total societies and layouts in your region (clickable — opens Browse Layouts filtered to your region) |
| Plots | 221 | Total plots across all societies, with "Available: 163" subtitle (clickable — opens Browse filtered to your region) |
| Sold Plots | 1 | Number of fully sold plots, with percentage of total (e.g., "0.5% of total") |
| Plot Collections | ₹5 | Amount applied to plot balances, with month-over-month change (e.g., "↓ 99.55% vs LM") |
| Members | 7 | Total registered members, with "New: 2 this month" and pending count |
| Bookings | 4 | Total bookings with "Confirmed: 4", and conversion rate change (e.g., "↑ 50% conversion") |

2. Trend Charts
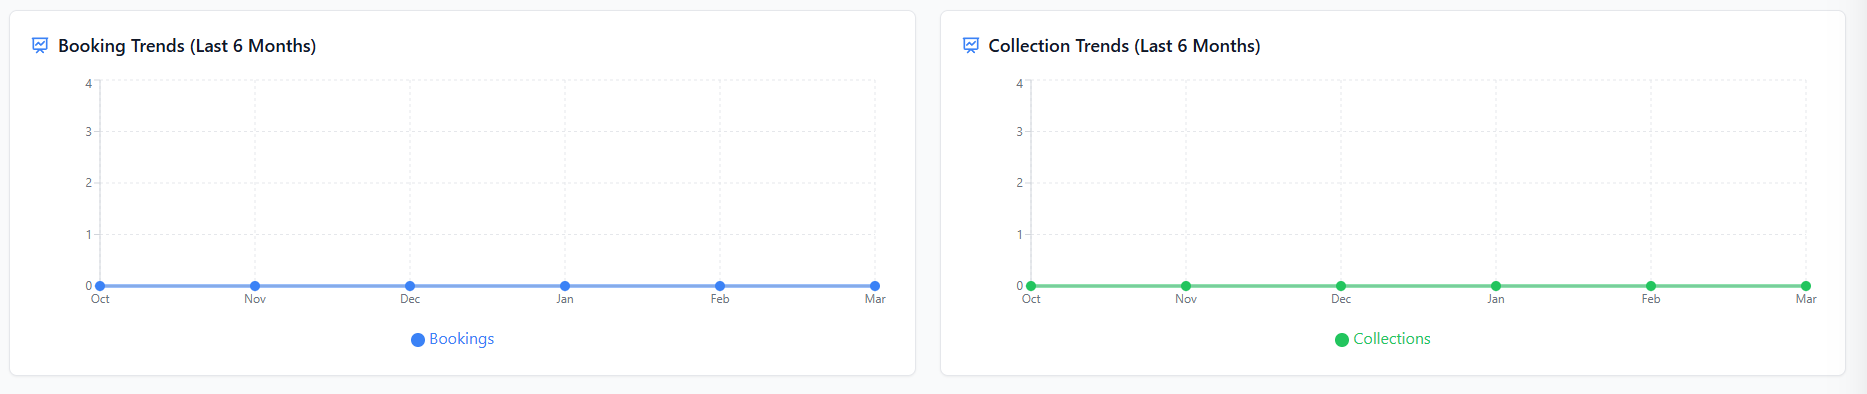
Two side-by-side bar charts showing 6-month trends:
| Chart | Description |
|---|---|
| Booking Trends (Last 6 Months) | Monthly booking counts across the region, displayed as a bar chart with month labels (Oct through Mar) |
| Collection Trends (Last 6 Months) | Monthly collection amounts in ₹ across the region, displayed as a bar chart. Hover over a bar to see exact value (e.g., "Dec — Collections: ₹21.66 L") |
3. Plot Status Distribution
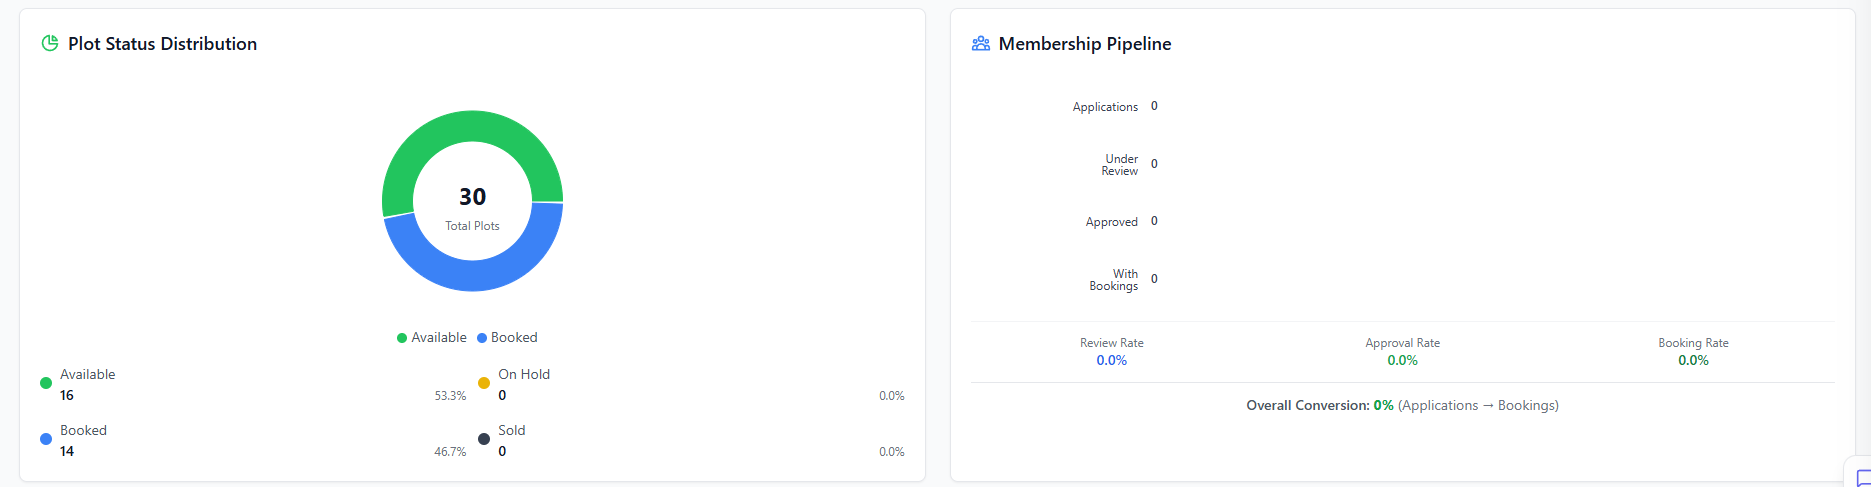
A donut/pie chart and breakdown table showing the status of all plots in your region:
| Status | Example | Percentage |
|---|---|---|
| Available | 163 | 73.8% |
| On Hold | 0 | 0.0% |
| Booked | 57 | 25.8% |
| Sold | 1 | 0.5% |
The chart shows the total number of plots in the center (e.g., "221 Total Plots").
4. Membership Pipeline
A horizontal funnel/bar chart showing member conversion stages:
| Stage | Description |
|---|---|
| Applications | Total membership applications received |
| UnderReview | Applications currently being reviewed |
| Approved | Applications that have been approved |
| WithBookings | Approved members who have made bookings |
Below the chart, three conversion rate metrics are shown:
- Review Rate — percentage of applications that reached review
- Approval Rate — percentage of applications that were approved
- Booking Rate — percentage of approved members who booked
A summary line shows: "Overall Conversion: X% (Applications → Bookings)"
5. Society-wise Performance Table
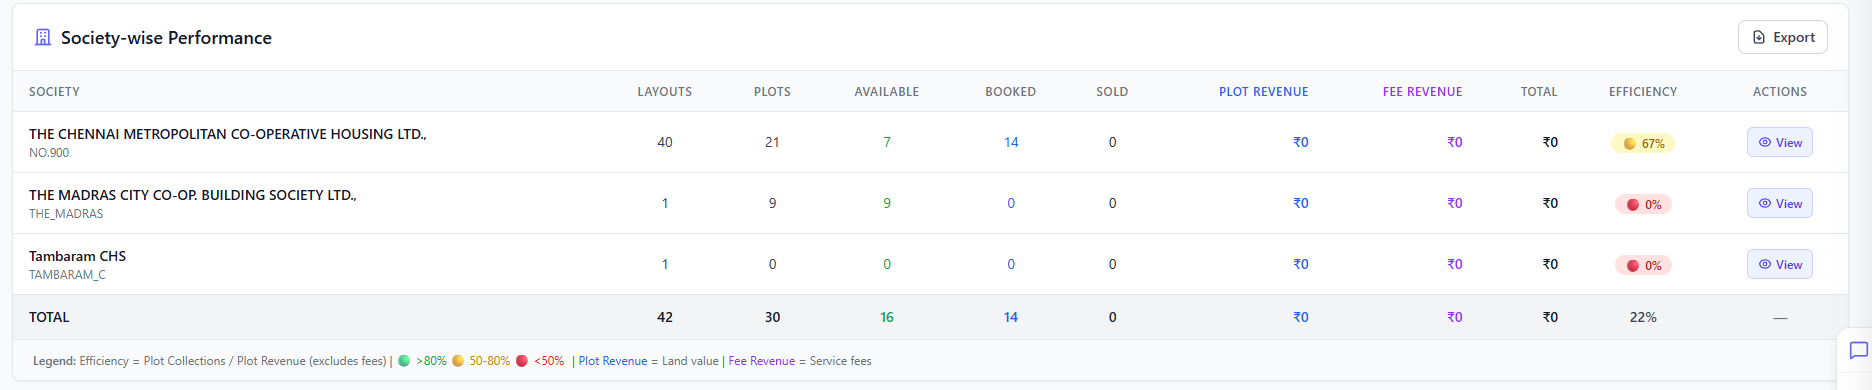
This is the core monitoring table showing each society's metrics:
| Column | Description |
|---|---|
| Society | Society name and code (e.g., "CMDA-CHN") |
| Layouts | Number of layouts in the society |
| Plots | Total plots |
| Available | Plots available for booking |
| Booked | Confirmed bookings |
| Sold | Fully sold and registered plots |
| Plot Revenue | Revenue from land value (plot payments) |
| Fee Revenue | Revenue from service fees (membership, processing) |
| Total | Combined revenue |
| Efficiency | Plot Collections / Plot Revenue — color-coded: 🟢 >80%, 🟡 50-80%, 🔴 <50% |
| Actions | View button to drill into the society dashboard |
A TOTAL row at the bottom aggregates all societies.
Legend: "Efficiency = Plot Collections / Plot Revenue (excludes fees) | Plot Revenue = Land value | Fee Revenue = Service fees"
An Export button above the table exports society performance data.
Viewing a Society's Dashboard
Click the View button in the Actions column to open a read-only society dashboard. See Society View for details.
6. Alerts & Action Items
Displays alerts requiring your attention. When no alerts are pending, shows "No pending alerts" with an icon.
A View All button expands to show the full alerts list.
7. Recent Activity
A chronological feed of the latest actions across your region:
Each activity entry shows:
- Icon — 📋 for bookings, 👥 for membership applications
- Description — e.g., "Booking CMDA-CHN-MOCC-XVI-2026-00010 - EXPIRED" or "Membership application - PENDING_VERIFICATION"
- Context — Society name, layout name, and the user who performed the action
- Timestamp — Relative or absolute (e.g., "5 Mar, 01:59 pm")
A View All button expands to show the full activity list.

8. Website Visitors
Shows visitor analytics for your region's presence on the platform:
| Metric | Description |
|---|---|
| Today | Visitor count for today |
| 30 Days | Visitor count for the last 30 days |
| Total | All-time visitor count |
9. Quick Actions
Shortcut buttons for common tasks:
| Quick Action | Description |
|---|---|
| 📊 MIS Reports | Navigate to Regional MIS Reports |
| 👥 Member Approvals | View member approval status |
| 📋 Audit Trail | Access audit logs |
| 💰 Revenue Analysis | View revenue analytics |
| 📈 Compare Societies | Compare society performance |
Some quick action buttons are placeholders and may not navigate to separate pages yet. The MIS Reports page is available at /admin/regional-mis-reports.
Using the Dashboard Effectively
Morning Review
- Check Alerts — address any critical items first
- Review KPA Summary — are numbers trending correctly?
- Scan Society Performance — any society significantly behind?
- Glance at Recent Activities — anything unusual?
Weekly Review
- Compare Trend Charts week-over-week
- Review collection efficiency across societies
- Identify societies that may need support
Monthly Review
- Expand trends to 6–12 months
- Analyze booking velocity by society
- Review the month's alert history
- Prepare regional summary for state-level review
Common Scenarios
"Which society is underperforming?"
Look at the Society-Wise Performance table:
- Sort by Collections or Efficiency in ascending order
- Societies at the bottom need attention
- Click into the society for detailed KPAs
"I see a critical alert — what do I do?"
- Read the alert details
- If it requires society-level action, contact the Society Admin
- If it requires escalation, contact the Super Admin
- Acknowledge the alert once reviewed
"Collections are declining in my region — how do I investigate?"
- View the Collection Trends chart for the pattern
- Check Society-Wise Performance to find which society is down
- Drill into that society's financial reports
- Check if it's a booking volume issue or a payment compliance issue
Related Pages
- Society View — Read-only society dashboard drill-down
- Society Layouts — Browse layouts within a society
- MIS Reports — Society-level operational reports with CSV export
- Audit & Escalations — Cross-society audit logs and escalation procedures
- Cross-Society Analytics — Comparative analysis